USER GUIDE
Joining a project
To join a project created by your organization or by any other person, go to Explore DEEP on the upper band of the platform (see the Explore DEEP section in Navigating DEEP for more information). On the bottom of the page, find a search bar that will allow you to locate the project that you want to join. Different filters can be used for this purpose: key words, organization, location, start and end date and the analysis framework used. As DEEP is open source, you will be able to view all projects that have been created on the platform.
Once you have found the relevant project, click on the Join option on the right side of the project. Since DEEP is a collaborative platform, your support of existing projects is always appreciated! To send your request, a tab will open to detail your interest in the project you are willing to join. Then click on the Join button visible in the open window.
When the project administrator/creator accepts or denies your request, the bell icon will appear. You may set-up your user profile (see User Profile section of this guide for more information) to receive this notification by email.
If approved, you can access the project on the Home page. It will also appear on the Tagging section. Select the project below the upper band and the imported sources will be available.
Advanced: Creating a project
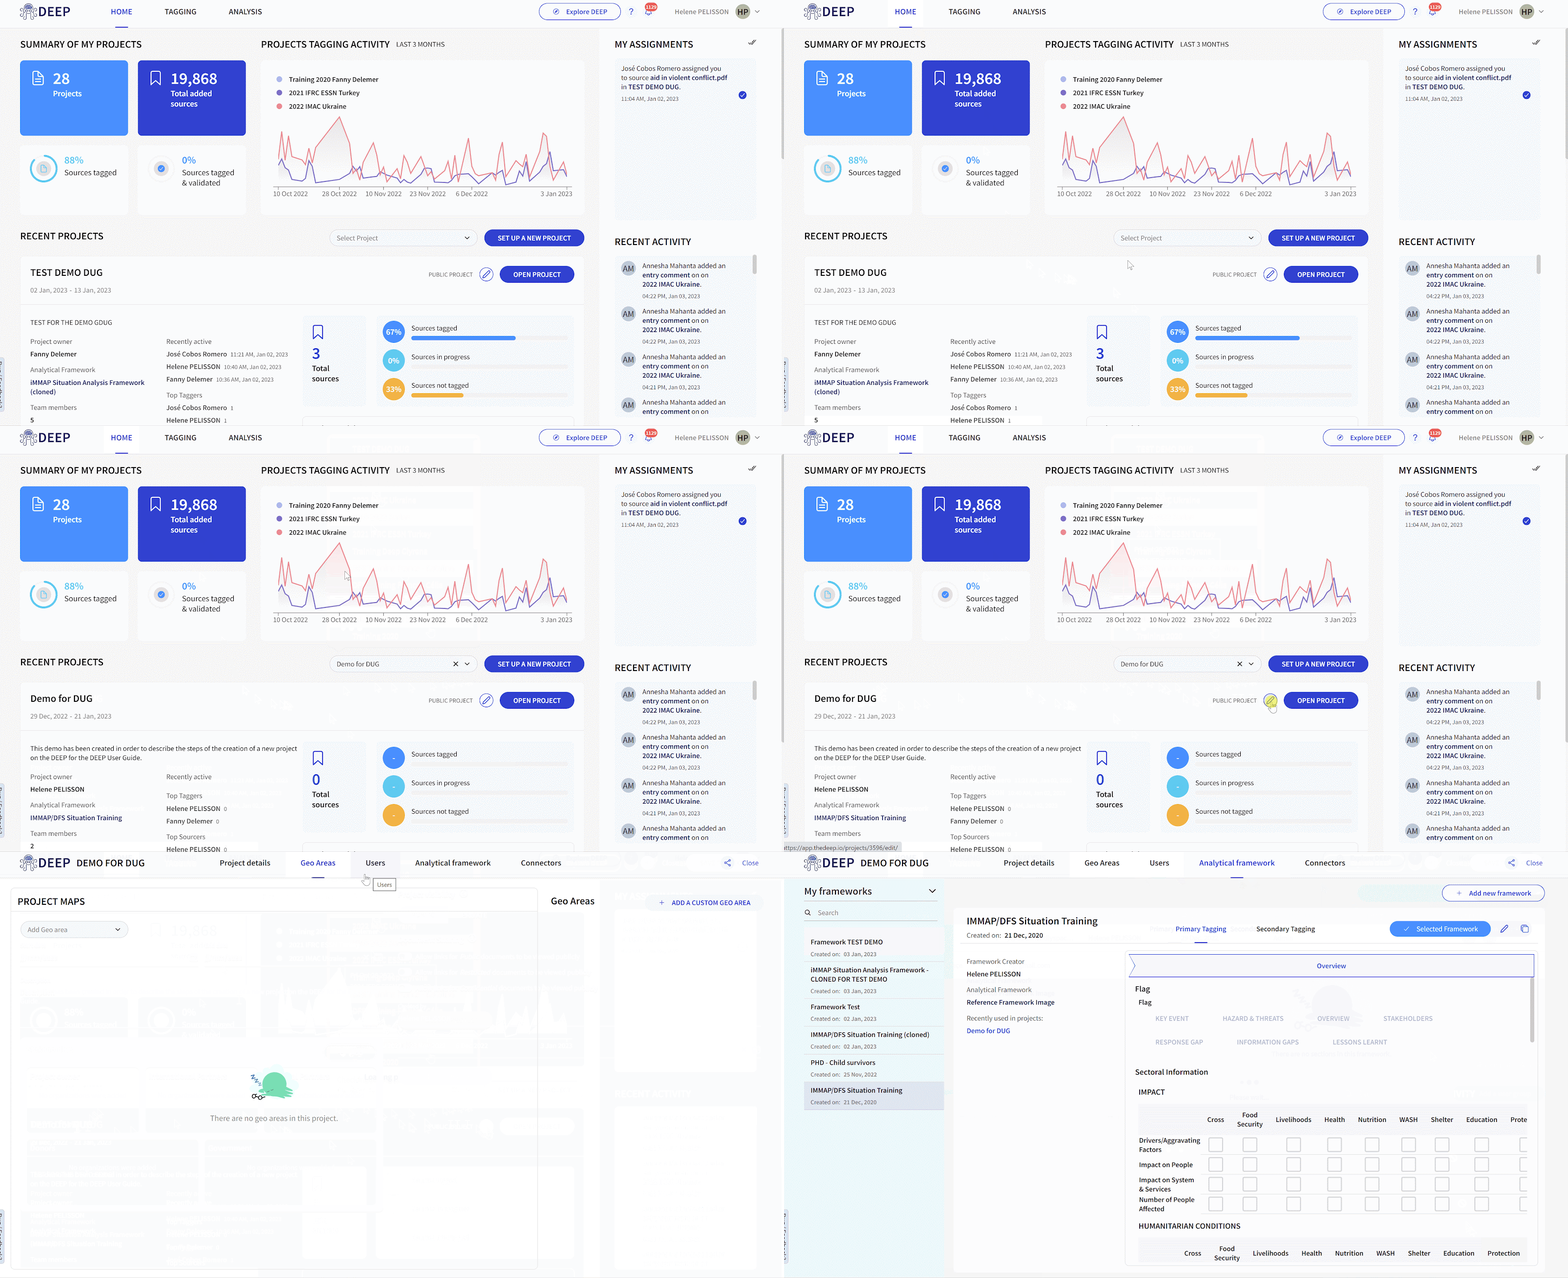
In order to create a new project on DEEP, access the Home page (see section of the guide on Navigating DEEP for more information). Below the boxes containing the main figures regarding your current projects (added sources, sources tagged etc.), locate the Recent Projects section.
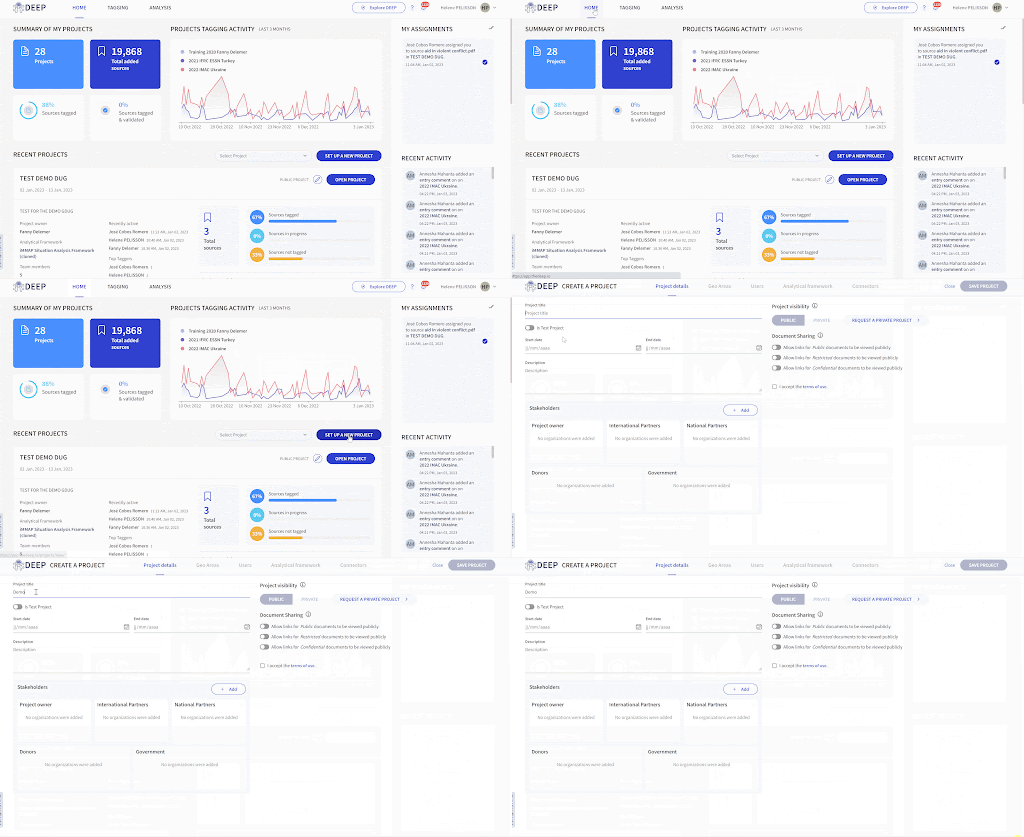
In order to create a new project on DEEP, access the Home page (see section of the guide on Navigating DEEP for more information). Below the boxes containing the main figures regarding your current projects (added sources, sources tagged etc.), locate the Recent Projects section.
Create Project: Project details
This tab will allow you to add the main details of your project.
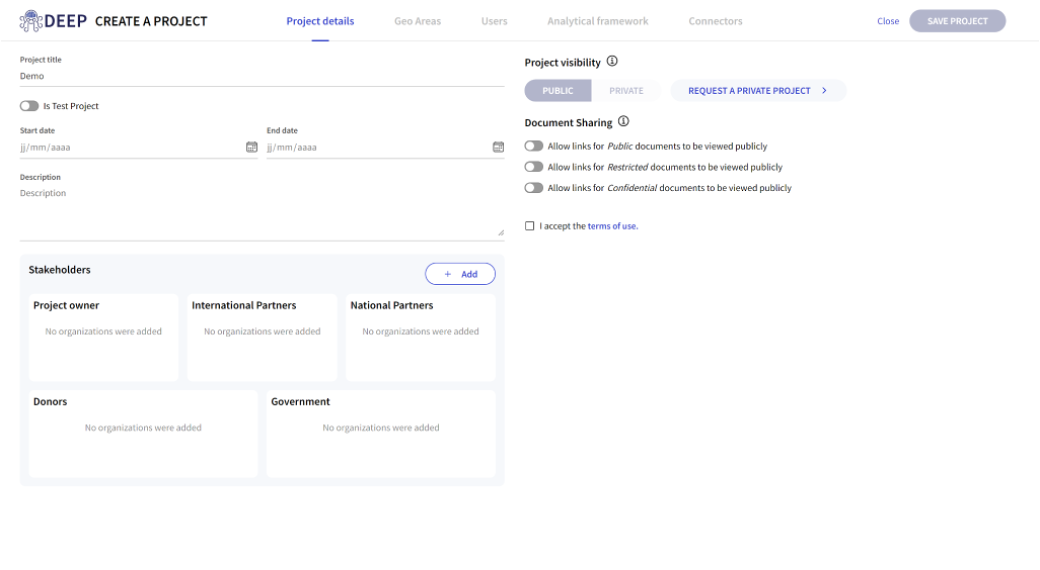
The first field enables you to add a Title to your project, indicate whether it is a test project or not, add the start and end date of your project and detail its Description.
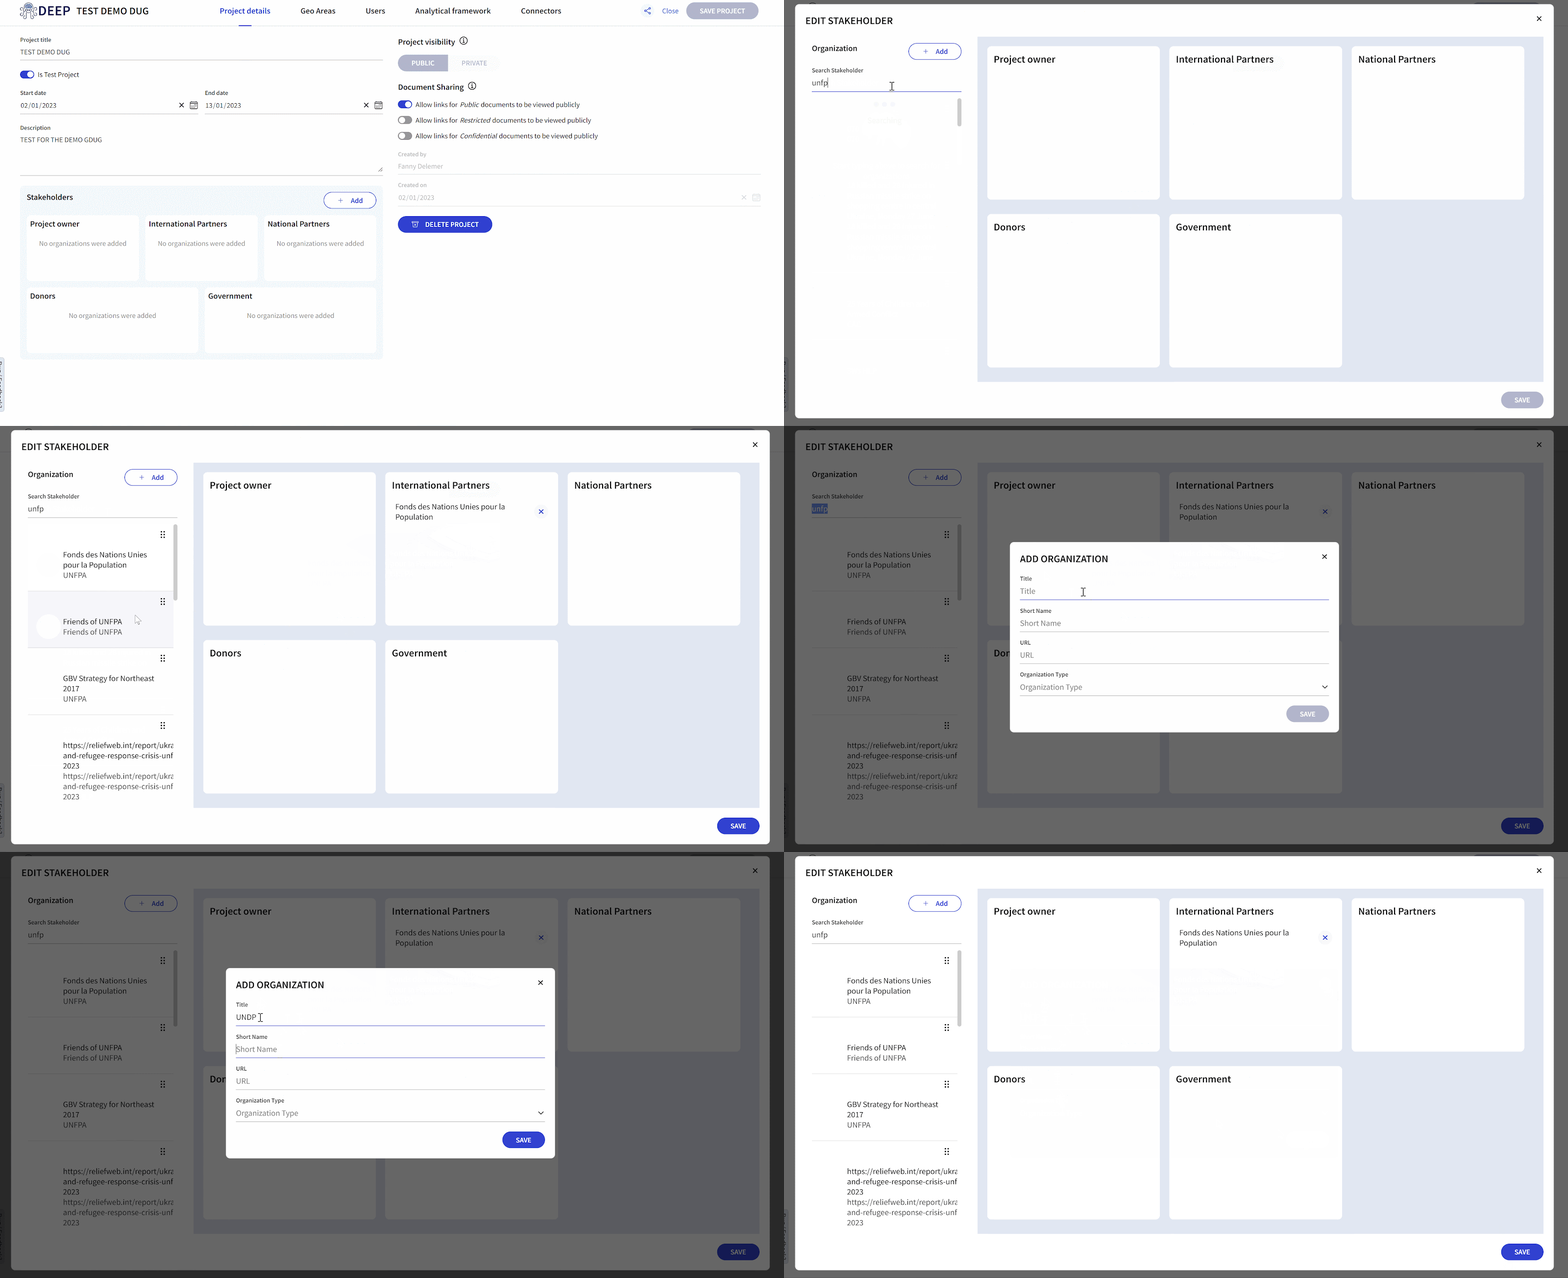
You can add Stakeholders to projects by clicking on the Add button in the Stakeholders square. The following categories will appear:
- Project owner. Add here the name of the organization(s) for which you work and that designed and launched this project. It can be several.
- International partners. This category includes any international partner working on the project, whether international non-governmental organizations, advocacy partners, etc.
- National partners. This category includes any national partner working on the project, whether local / national associations, local / national non-governmental organizations, etc.
- Donors. This category should include any donor that is or will be funding the project.
- Government. This category includes any governmental agency taking part in or supporting the project.
Locate organizations in the search bar on the left hand side. Click on the rectangle next to the organization’s name, drag and drop it in the relevant category of stakeholder on the right hand side. Since DEEP is collaborative, many organizations are registered. Frequently there are duplications. The DEEP management team regularly verifies organizations registered on the platform. A green checkmark (or tick) to the left of the organization’s name means that it has been verified and should be used rather than an organization with a similar name without this tick.
If the organization for which you are searching does not appear, you can add it to the registry. This is an easy process. Click the Add button, then type the name of the organization, its short name (or acronym), the type of organization and preferably a URL (though this is not compulsory). For type of organization select from among the following: UN agencies, Donors, Clusters, National NGOs, Red Cross/ Red Crescent Movement, Non-Governmental Organization, Media, International Organization, Government, Academic and Research Institution and Others. After completing all required fields, you will be able to Save this new organization. Then you can drag and drop it in the relevant stakeholder category.
On the right hand side of the page, the Project visibility section will enable you to decide whether you want your project to remain public or to become private/confidential. For it to become private, send a request by clicking on Request a private project. In the new window, explain the scope and objectives for your project as well as the reason for requesting a private environment. Click on the Save button to send the request. Kindly note that private projects are exceptional on DEEP. DEEP was designed to be a collaborative and transparent tool and all the data gathered and collated on DEEP projects are safe even when the projects are public and visible to other users. By putting your mouse on the ? icon next to Project Visibility, you will have more details on the difference between public and private designations for projects. For more information on data protection on the DEEP, refer to the section on data encryption on the DEEP website.

In the Document Sharing section, determine which links will be viewed publicly. Click on the relevant statement in order to agree with it. The button will then turn blue, showing your agreement. None of these three statements is mandatory. If you allow the confidential documents to be reviewed publicly, a pop-up window will ask you if you are sure about your choice.
IMPORTANT: Accept the terms of use before saving your framework and moving to the next steps.
Create Project: Geographic areas
In this section, you will be able to select the relevant geographic areas for your project. This will enable you to tag locations during the second level of Tagging (see Tagging section of this guide for more information).

In the Project Maps, you can select a geographic area by scrolling down or writing the name of the searched area.
Once you have picked an area, the map of the country will appear and you will be able to see the division by administrative level 1 and 2 depending on the areas. The details of these levels will appear on the right hand side of the map, by clicking on the small arrow next to the area’s name.
You can select as many areas or countries as needed for your project. You can delete one by clicking on the bin icon next to the area’s name on the right hand side.
If the area you are looking for does not appear or not with the administrative levels you need, you can Add a custom area by clicking on the relevant button. You will then follow the steps detailed below the screenshot.
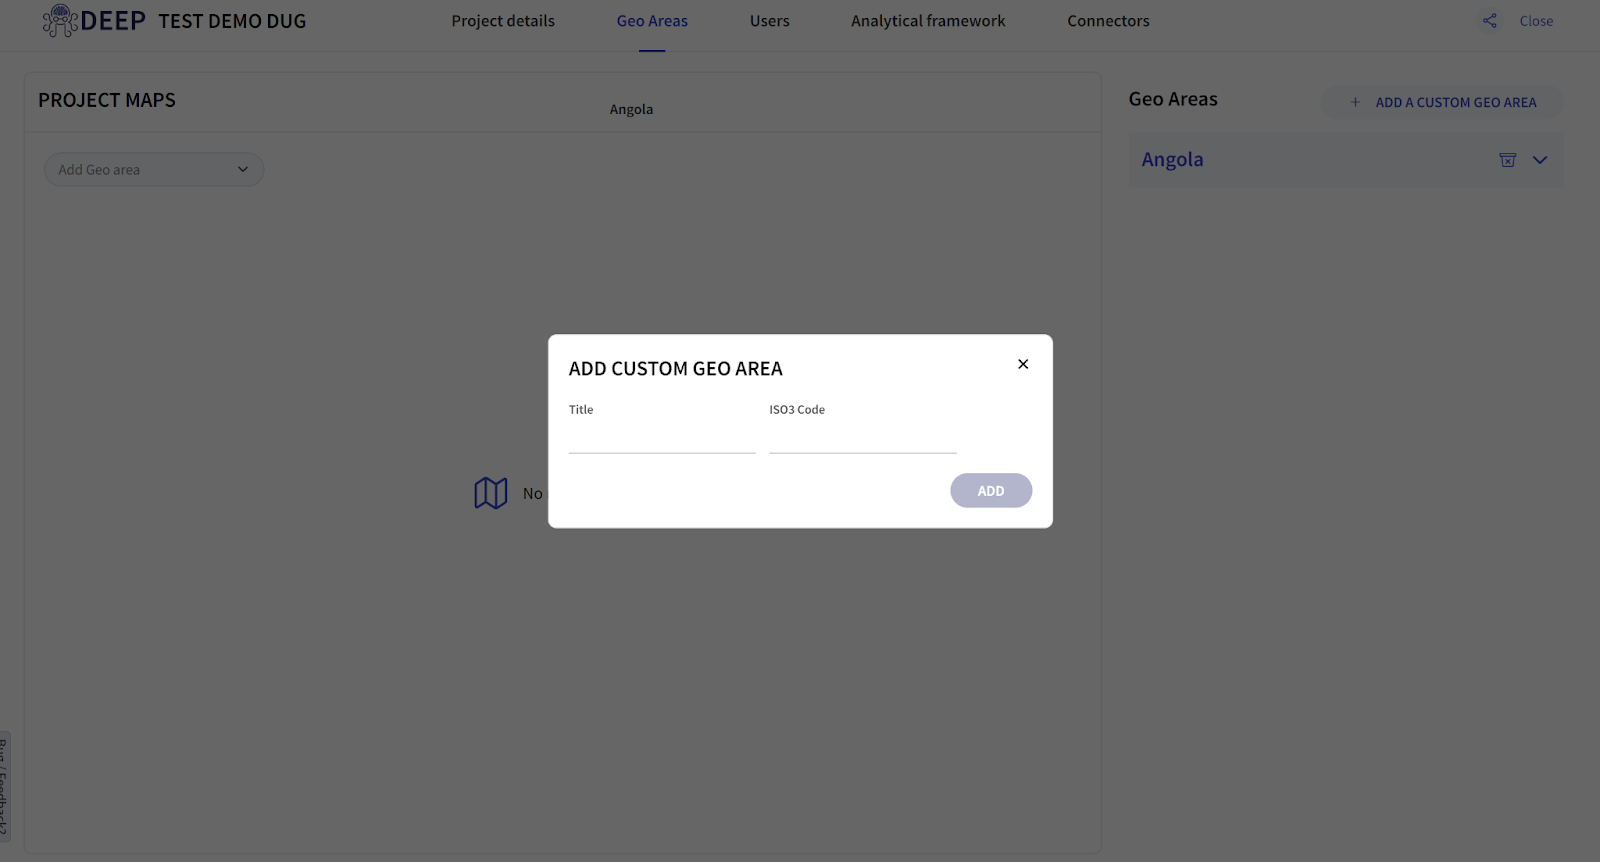
Search for the shapefiles of the geographic area you want to cover. Some of the sources used on the DEEP are GADM, HDX, GeoBoundaries, and Princeton.
After locating and downloading the shapefiles to your device, upload the shapefiles in https://mapshaper.org/
While uploading shapefiles in mapshaper, make sure that the ‘detect line intersections’ option is checked.

After the shapes have been imported in mapshaper, click on the arrow button on the right side and select ‘inspect features.’

Then click on the shape to view details like these:
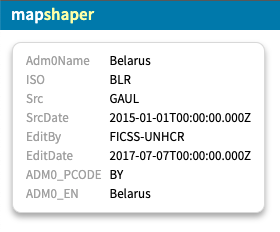
You can then open DEEP and click on Add a custom geo area button in the Geo Areas page of the project.
You should see a pop-up to input NAME and CODE for the geo area. Input them and click on the ADD button.
Then you can click on the Add admin level button and attach the ‘admin level 0’ shapefile in the first field.
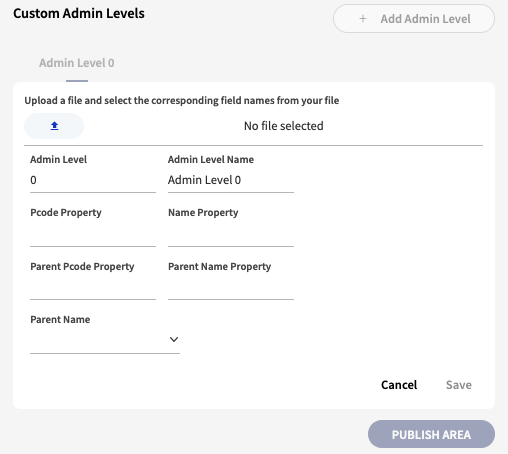
Input the admin level of the shape in the ‘Admin Level’ field. For example, if it is admin level 0, input ‘0’ in the admin level field.
Input the administration-level name of the shape. For example, if it is the country’s shape, then input ‘Country’. If it is the district’s shape, then write ‘District’.
Input the Pcode Property and Name Property. You will get these details from the mapshaper in step 4.
Leave the ‘Parent Pcode Property’ and ‘Parent Name Property’ fields empty if you’re uploading an admin0 shapefile. If you are uploading admin1, admin2 or admin3 shapefiles, you will have to input ‘Parent Pcode Property’ and ‘Parent Name Property’ as well. You can repeat step 3 and 4 with admin1, admin2 shapefiles in mapshaper to get their Pcode and Name Properties. In order to link the maps, you have to make sure you input the ‘Parent Pcode Property’ and ‘Parent Name Property’ fields correctly. For example, ‘Pcode Property’ and ‘Name Property’ of admin0 shapefile are ‘Parent Pcode Property’ and ‘Parent Name Property’ for admin1 shapefile.
Next, select the parent name from the ‘Parent Name’ dropdown if you are uploading admin1, 2 or 3 shapefiles.
Click on the SAVE button after you have uploaded each admin-level shapefiles.
Once you have saved all the levels of shapefiles, double-check everything and click on the PUBLISH button.
Create Project: Users
In this section, pick other potential users that will be working with you on this project. Depending on the role that you will assign them, they will be able to import sources, tag, export, edit the project, etc. The page offers two categories: Project users and user groups.
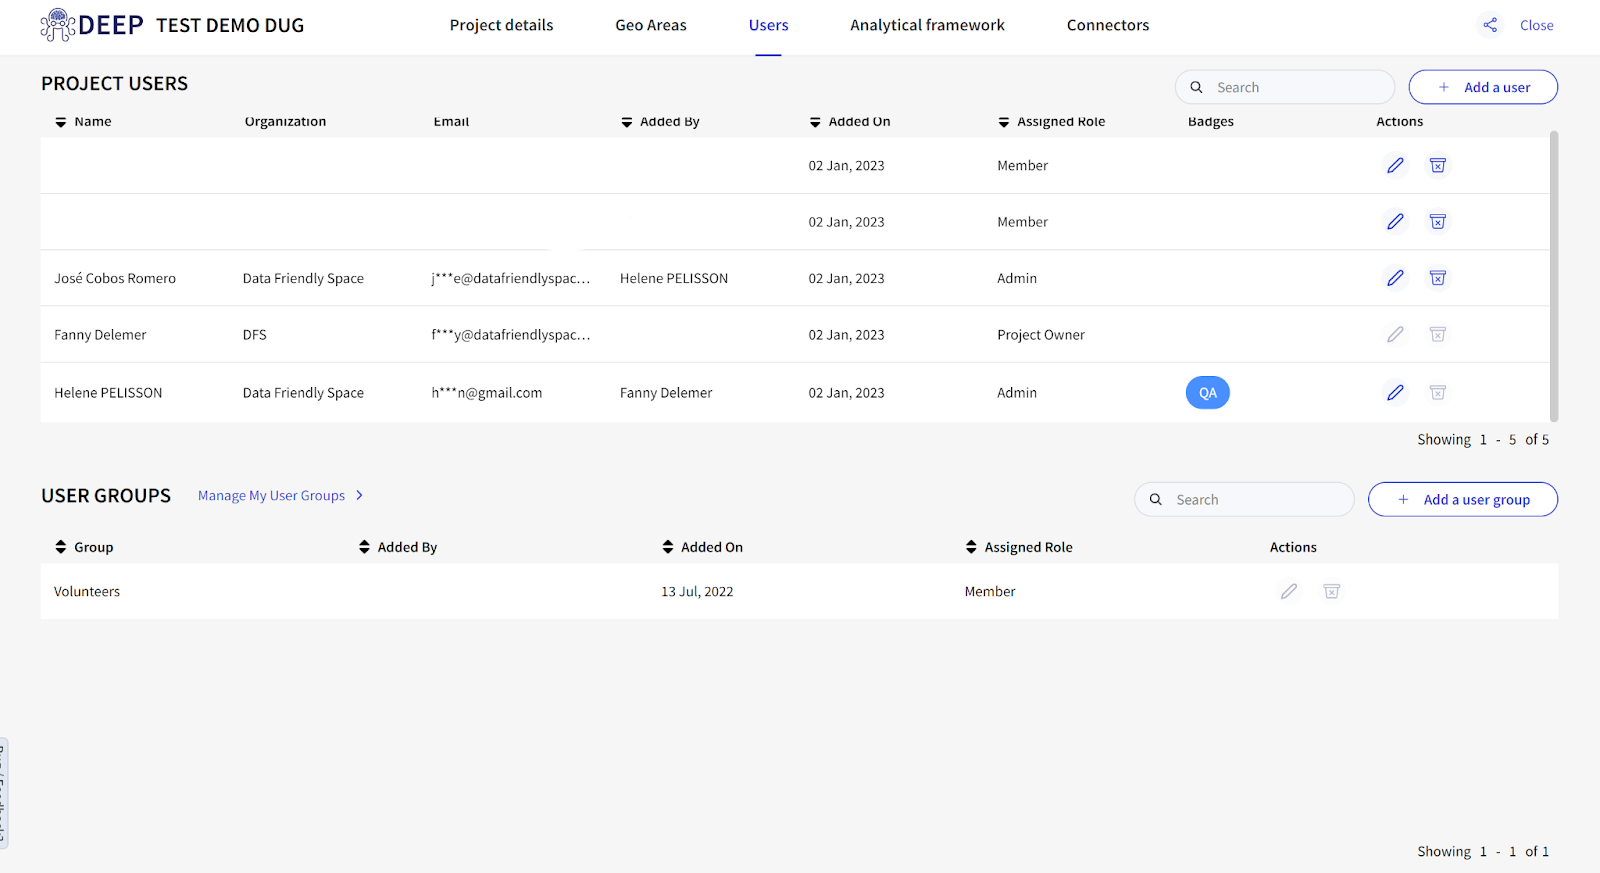
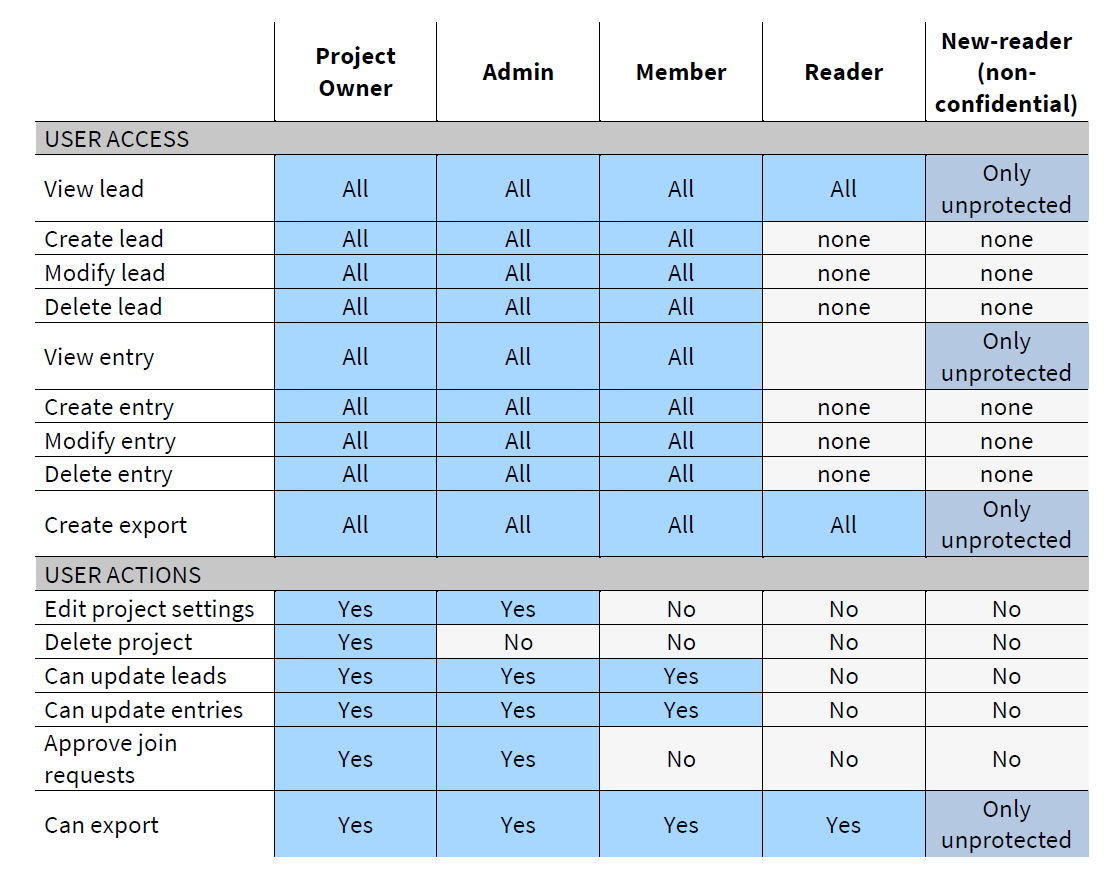
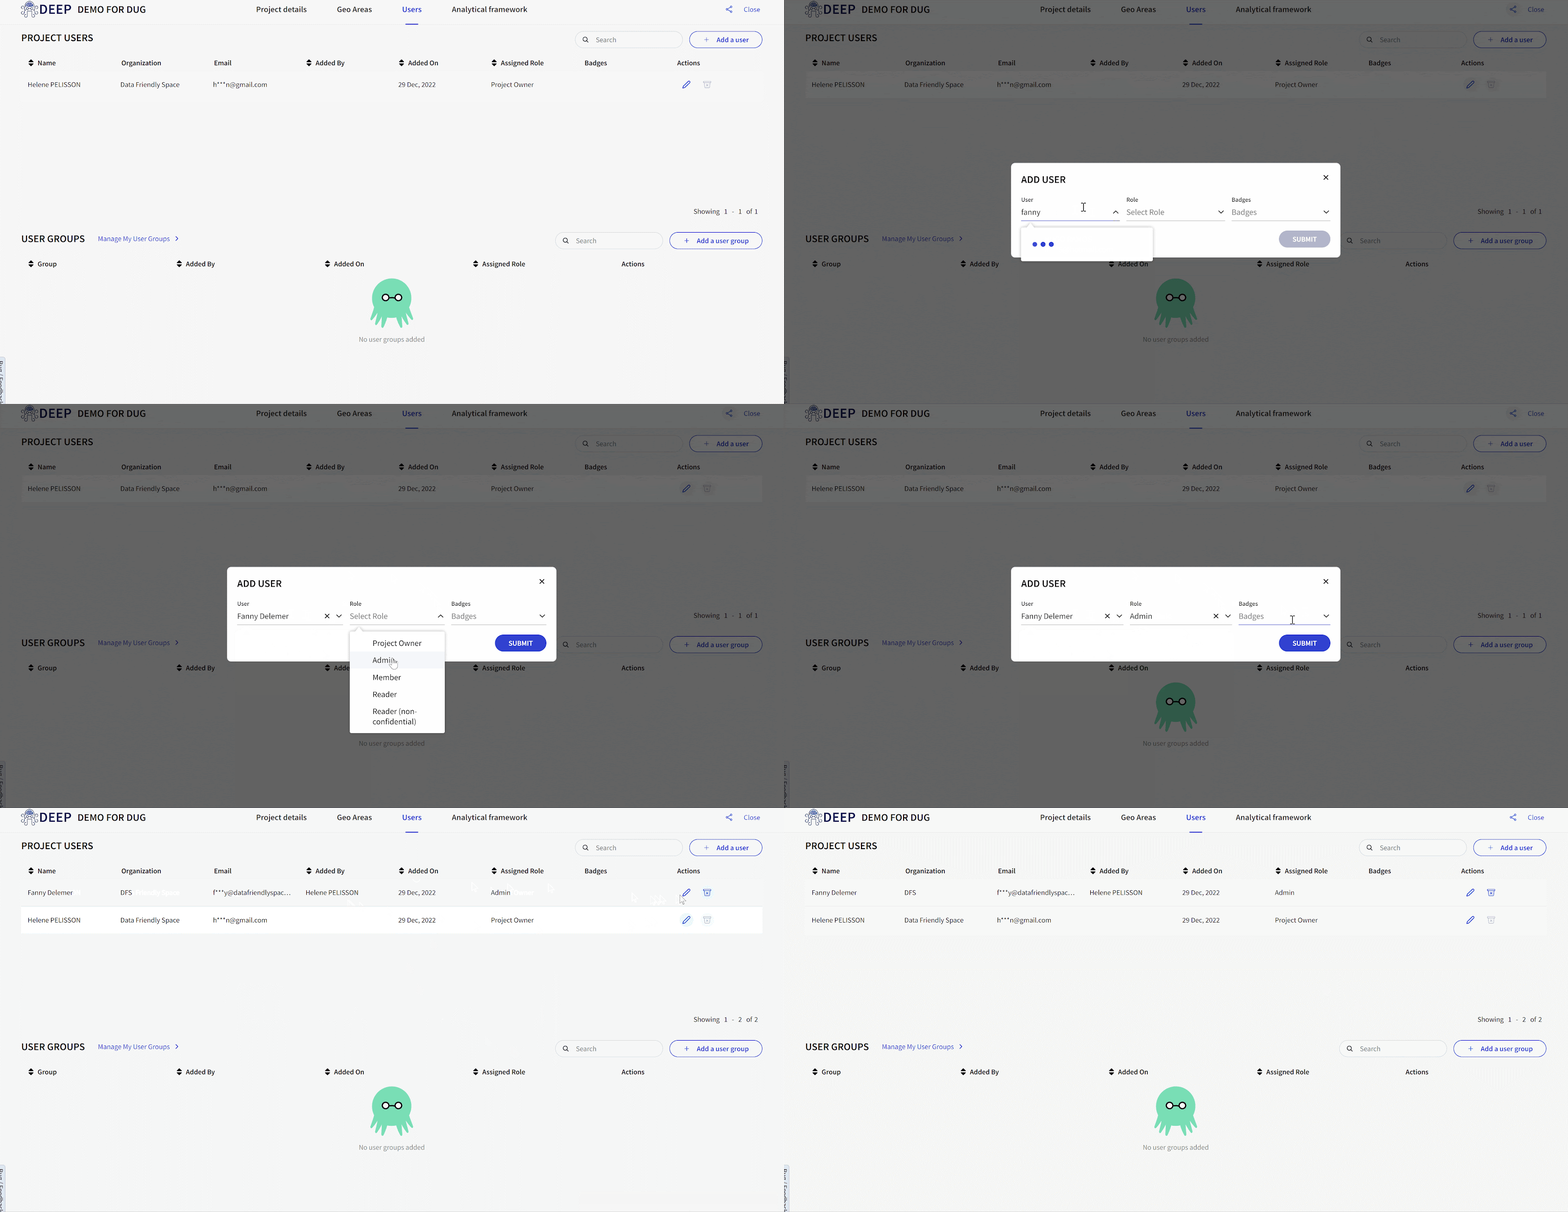
The Project Users will be the users taking part of the project. To add new users, click on the button Add a user and then type and/or scroll for the name of the person in the search bar, then select their role (admin, member, reader, non-confidential reader) and finally add a badge (not mandatory). The following table details the abilities given to a user depending on their role:
Once you have added users, you will see their name appearing in a list under the project users along with their organization, email address (encrypted), the person who added them, the date when they were added, their assigned role and their badge.
You can edit or delete a member at any time by editing your project (in the Home page, selecting in the scrolling menu your project, clicking on the pen button to edit it).
You will also be able to look for a particular member through the search bar. This is very helpful for projects with many users.
Create Project: User groups
The User Groups category allows you to add an existing user group to your project. User groups are designed to have an already formed team when working on several projects, without having to add users one-by-one in each project. For example, you will be able to assign more easily tagging several people within a project. For more information, please refer to the section on User Groups in Navigating the DEEP part of this manual.
You can Add a user group by clicking on the relevant button. You will have to look for the name of the user group and scroll down to pick the one you are looking for. You will then need to assign a role to this group (see the roles and the abilities depending on the role in the table above).

Analytical Framework
After deciding on the project’s details and users, you will have to pick or create an analytical framework.
What is an Analytical Framework?
The Analytical Framework in DEEP is the foundation of your project and will help you structure your data collection. It can be understood as a closet with a collection of drawers in which you can store information from your sources by category and extract as needed. When creating a project, establishing the analytical framework is one of the most important steps. The analytical framework will be the foundation of your future analysis; without it, you will not be able to tag and process information in a structured way. It is highly recommended to have a look at the following course on Analytical Frameworks (Kaya) to learn more about methodology and best practices if you are new to this concept.
Choosing an existing framework
On the left side of the screen, there is a category called My frameworks presenting below it all the frameworks you have used so far. You can also click on the arrow to scroll to All frameworks.
Since DEEP is open source, you will be able to view the list of all frameworks used in the platform. You can search for a framework via the Search bar. As stated on the Explore DEEP page, the five most used frameworks are IFRC Master Framework 2019, IMMAP/DFS Situation Analysis Framework, Togglecorp Generic Framework for Training, Nigeria MSNA 2020 and HALEP risk analysis.
The framework will appear on the right. You will be able to view the framework details, its creator, its date of creation and the type of analytical framework. You will also be able to Select framework to apply it to your project; edit it before adopting it (pen icon) or cloning it (sheets icon).
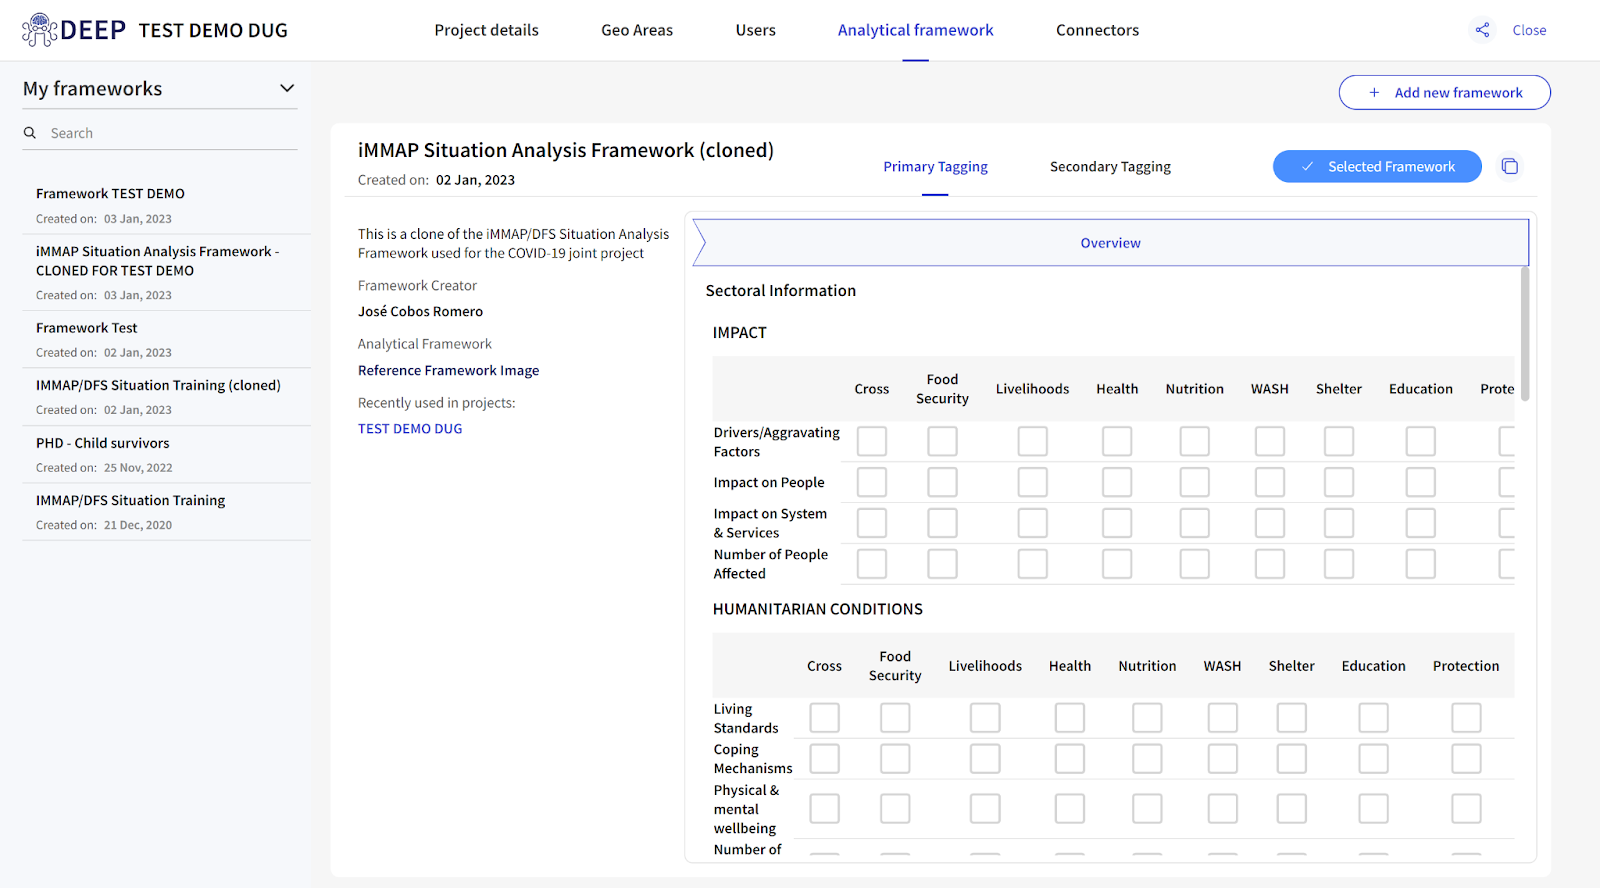
Note: If you choose a framework that already exists and the framework creator changes the framework, it will also change in your project.
Cloning an existing framework
Instead of using a framework that already exists and can change if modified by its creator, you can choose a framework that already exists and clone it. You will then be able to edit the new version as you like without changing the former version and affecting the projects connected to this former version.
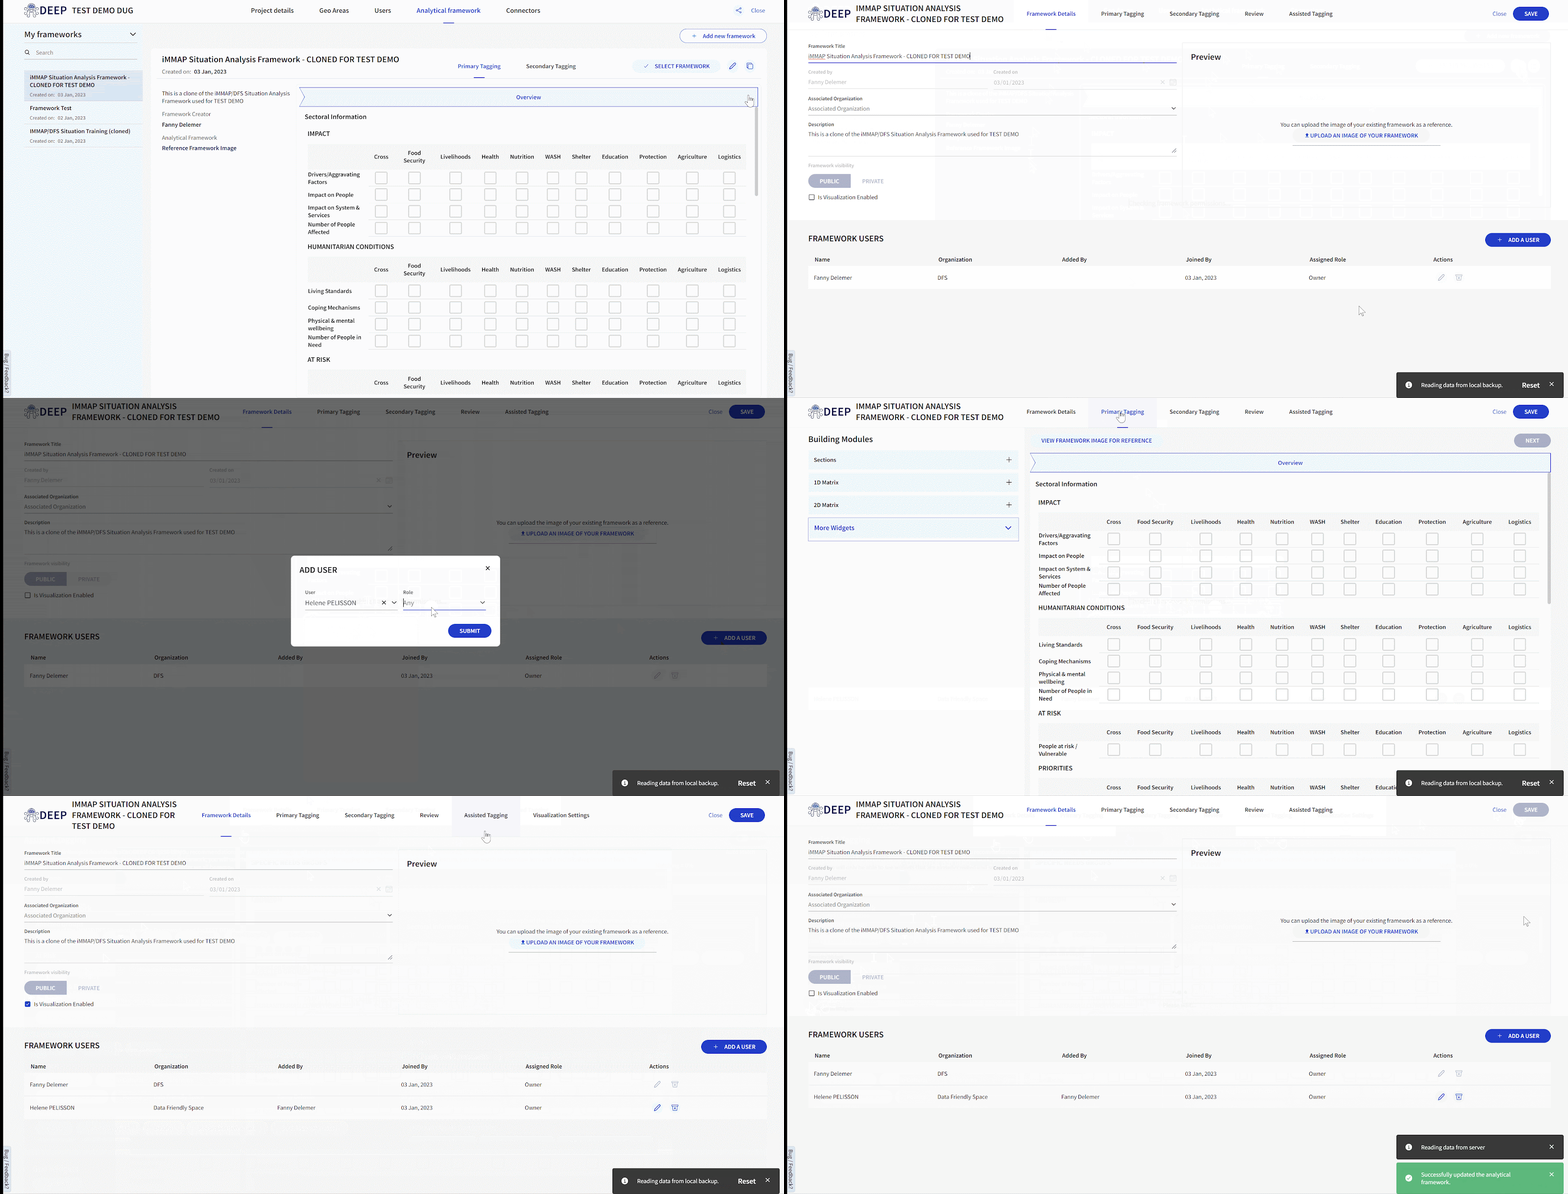
On the right side, click on the sheets icon (next to select framework). A window will open. You can change the title and add a description, then submit and it will create a copy of the framework. When your copy is created, you click on the pen icon and edit (next to select framework).
When you edit a framework, you have access to a tab with Framework Details indicating the metadata linked to the framework (Framework Title, creator, date of creation, associated organization, description). A preview is accessible if an image has been uploaded as a reference and the list of framework users appears down to the screen where you can Add a user.
The second and third tab allow you to edit the primary Tagging and secondary Tagging dimension of the framework. The fourth tab allows you to review your framework. The final tab allows you to work on assisted Tagging. If the visualization is enabled in the first tab, you can also access a last tab called Visualization Settings. All those functions are further explained in the next section.
Creating a new framework
On the top right corner of the opened page, you will see the option allowing you to Add a new framework. Clicking on it will open a new page guiding you through the process of creating a new framework to connect to your project. This new page gives you an interface where you have six tabs to complete.

Framework Details Tab
On this first tab, you can add all metadata that will characterize your framework:
- Framework title
- Creator
- Date of creation
- Associated organization
- Description of the project
Remember to save your work. In order to add users, the framework must be saved.
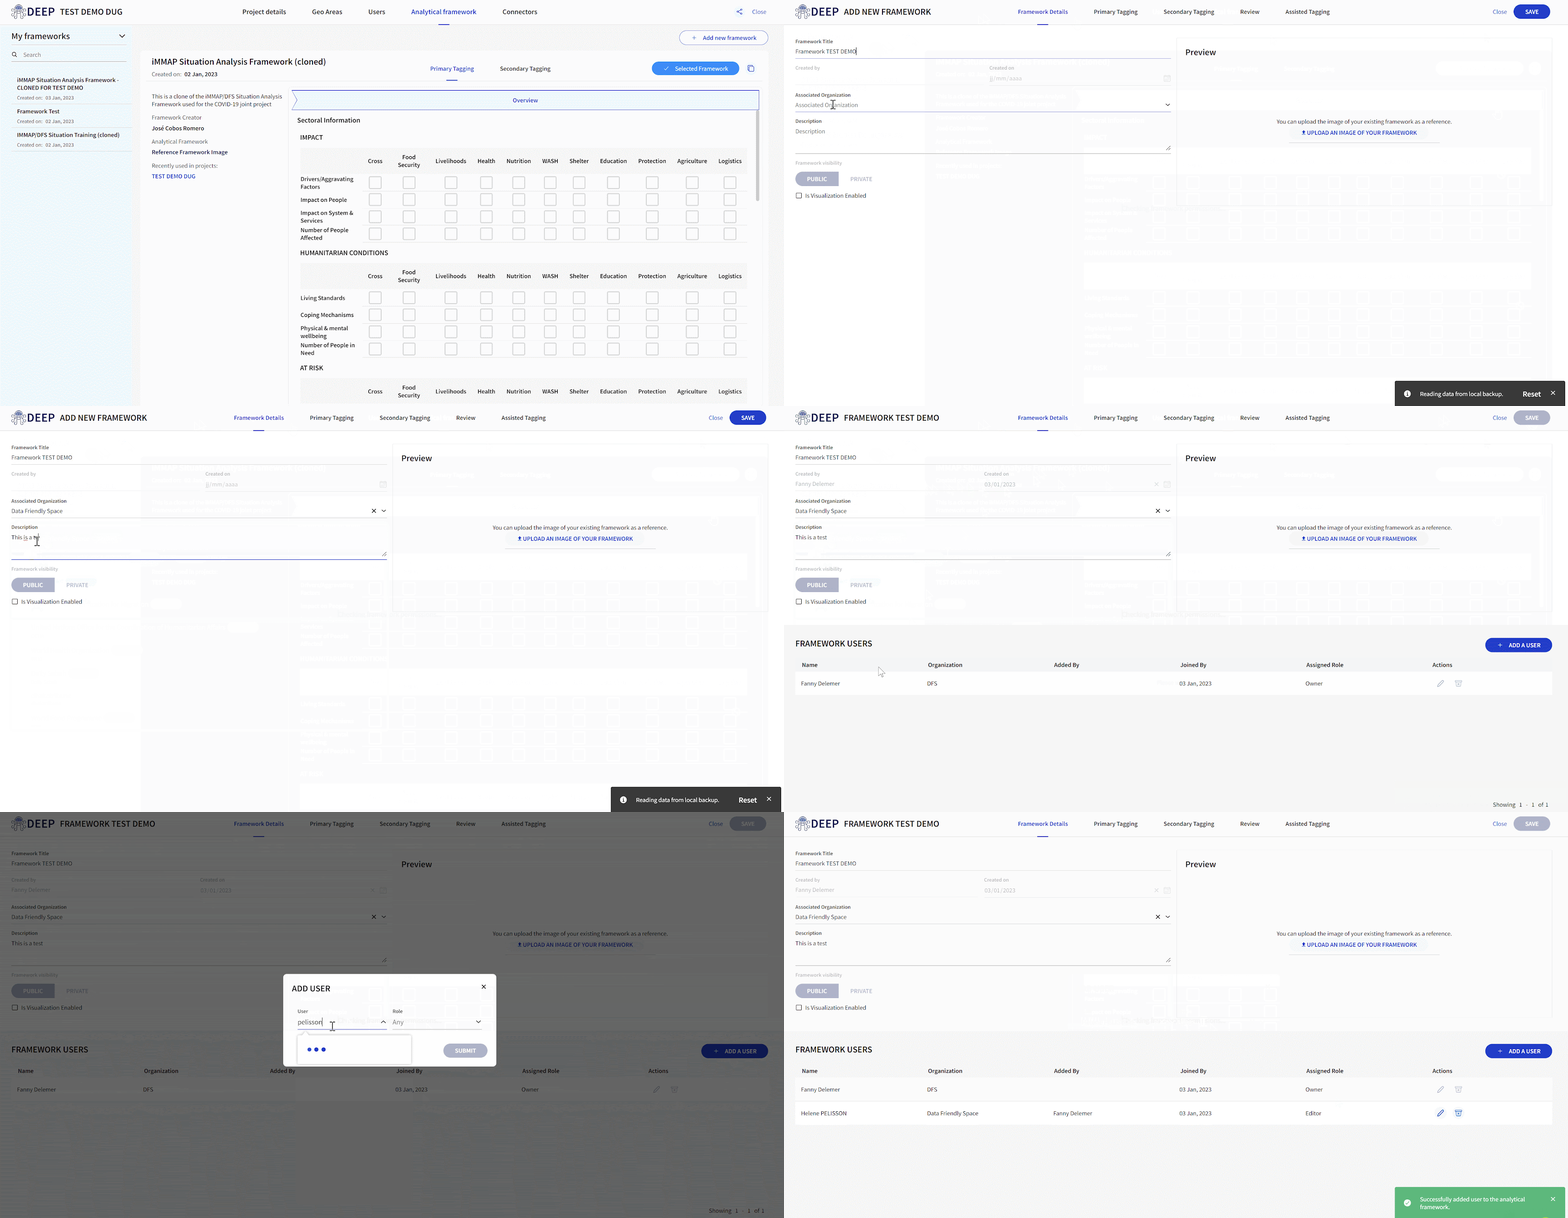
You then have a section regarding the framework visibility. All projects and frameworks are originally set up to be public. As such, the framework can be used for other projects or cloned to serve as a basis for other frameworks. However, the only ones who can edit your framework are owners – either you as the original owner or those added as owners. If you want to turn your framework to be private, you need to send a request to the DEEP team.
Coming soon
You can also click on “Is Visualization Enabled” that opens a new tab called “Visualization Settings”. More information about the Visualization Settings tab will come soon in the Deep User Guide!
In this tab, you can also add a visual in the preview window. The image you choose to upload will be the reference of your framework. Then you have the framework users listed down on the screen. You can add a user and assign a role to this user.
Primary Tagging Tab
The primary Tagging page is divided into two main spaces. On the left side of your screen, you have the Building Modules where you can add sections, where you have the possibility to build a 1 dimension matrix or a 2 dimensions matrix and other widgets such as text, number, date etc… and on the central part of your screen the framework you’re building emerges while your building modules.
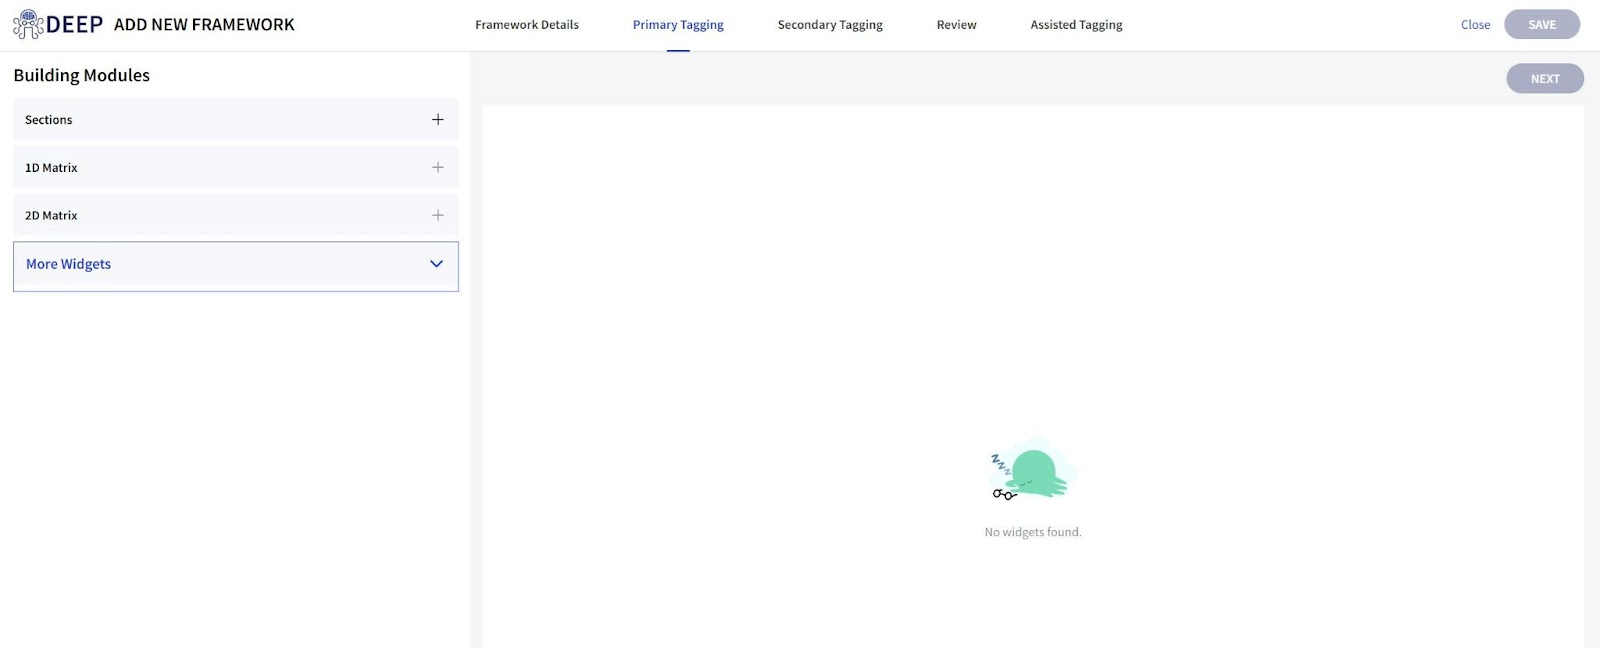
Building modules
Sections
To start creating your framework, add a section by clicking on +. Label the section with a title and provide complementary information regarding your section on tooltip, which will appear when you hover your mouse over the corresponding category before clicking. Your section appears on the top of your central window.
You can add different sections by clicking on + again, delete them by sending them to the bin, modify information regarding the section by clicking on the arrow and, finally, change the order of the section by dragging them around after clicking on the six points to the left of the title. This applies for every widget you create in the analytical framework.
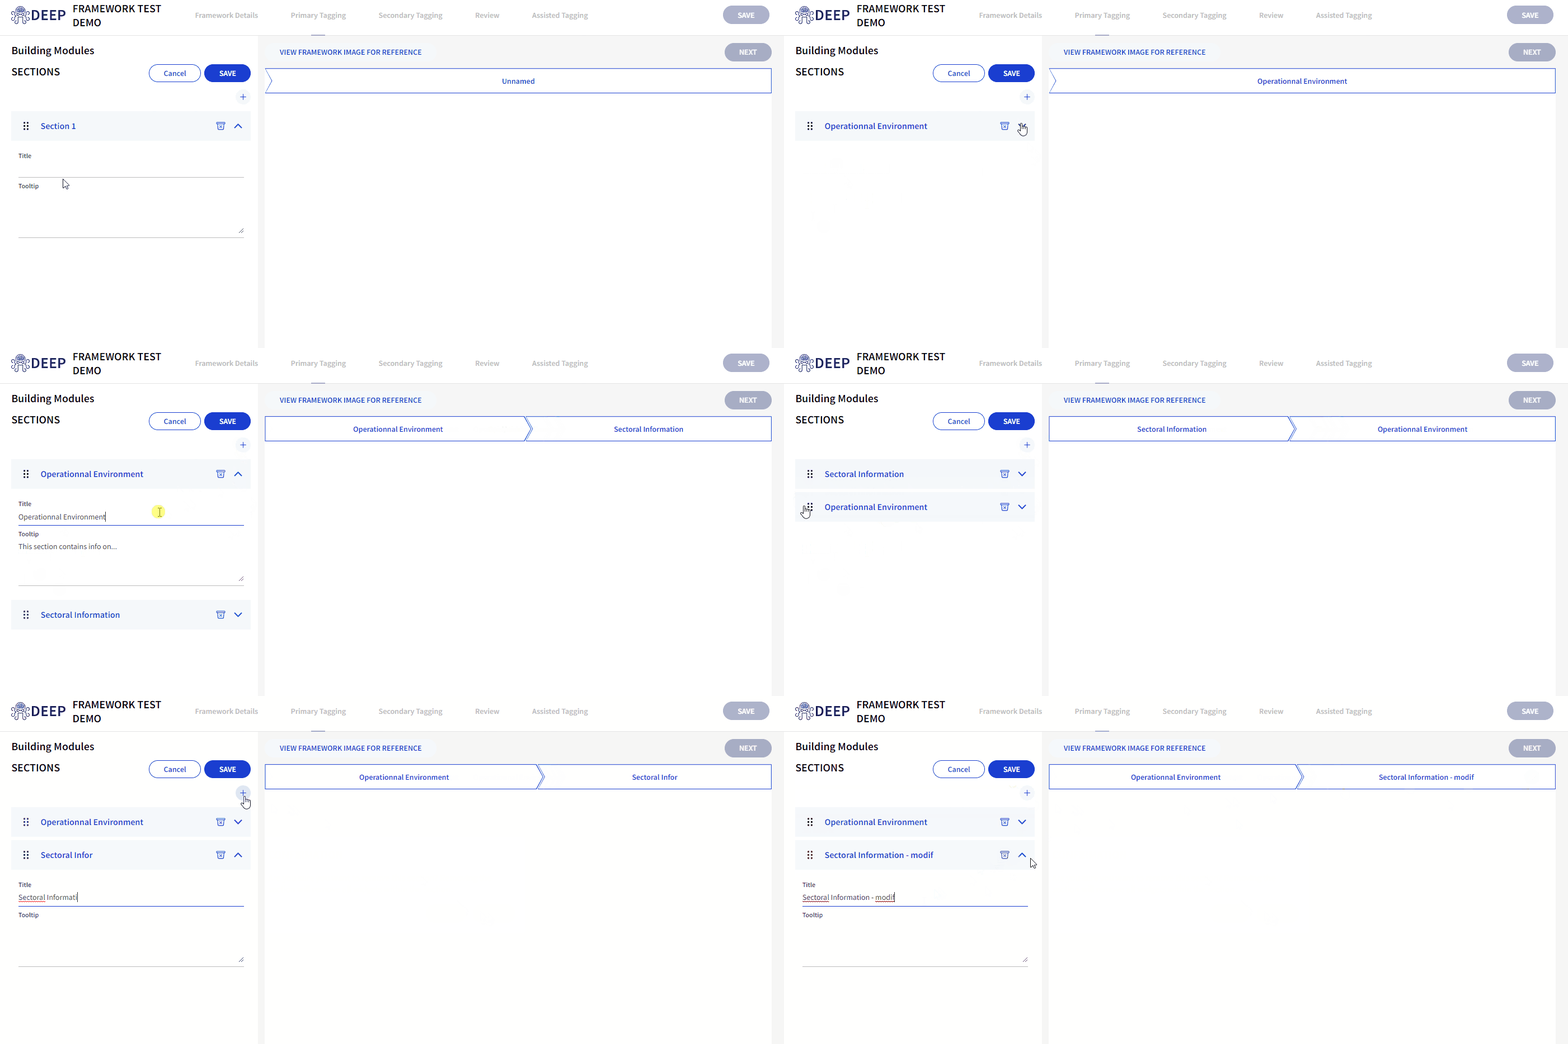
1D Matrix
To add a 1D matrix, select on a section you have created in the central part of your screen where your framework appears, and then click on + to add a 1 dimension Matrix.
You must first indicate what will be the title of your matrix. Then you can add rows that you have to label and then add a description in the Tooltip. Under each row created, cells can be added to identify specific information in one dimension matrix.
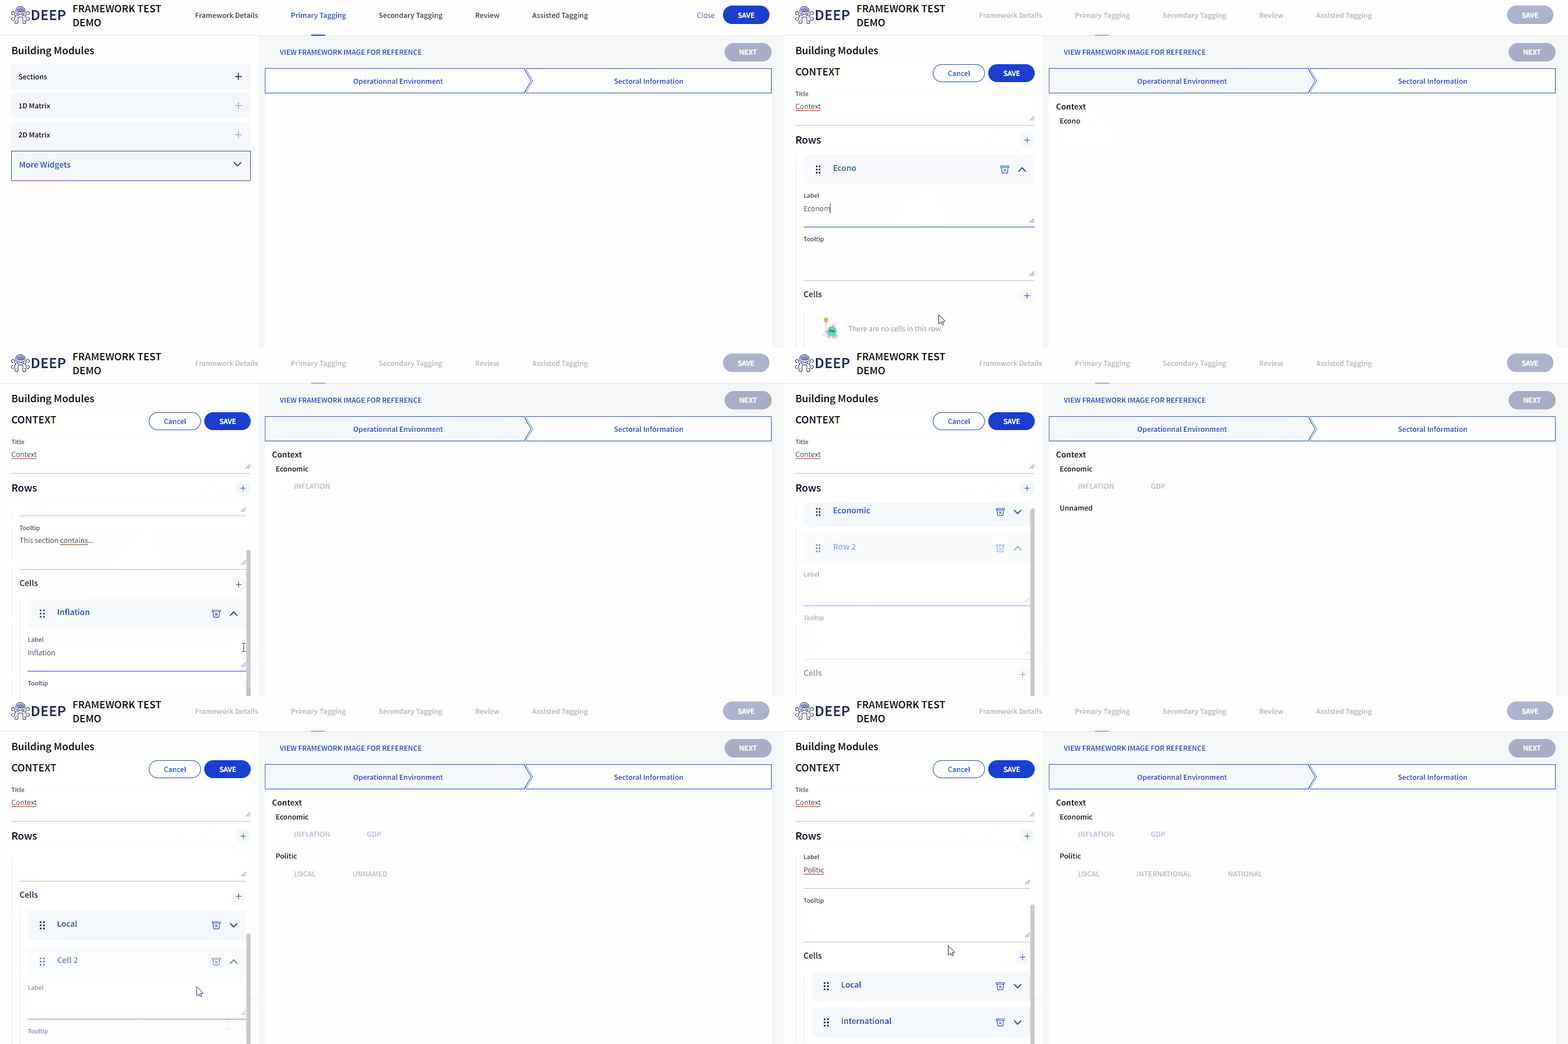
2D Matrix
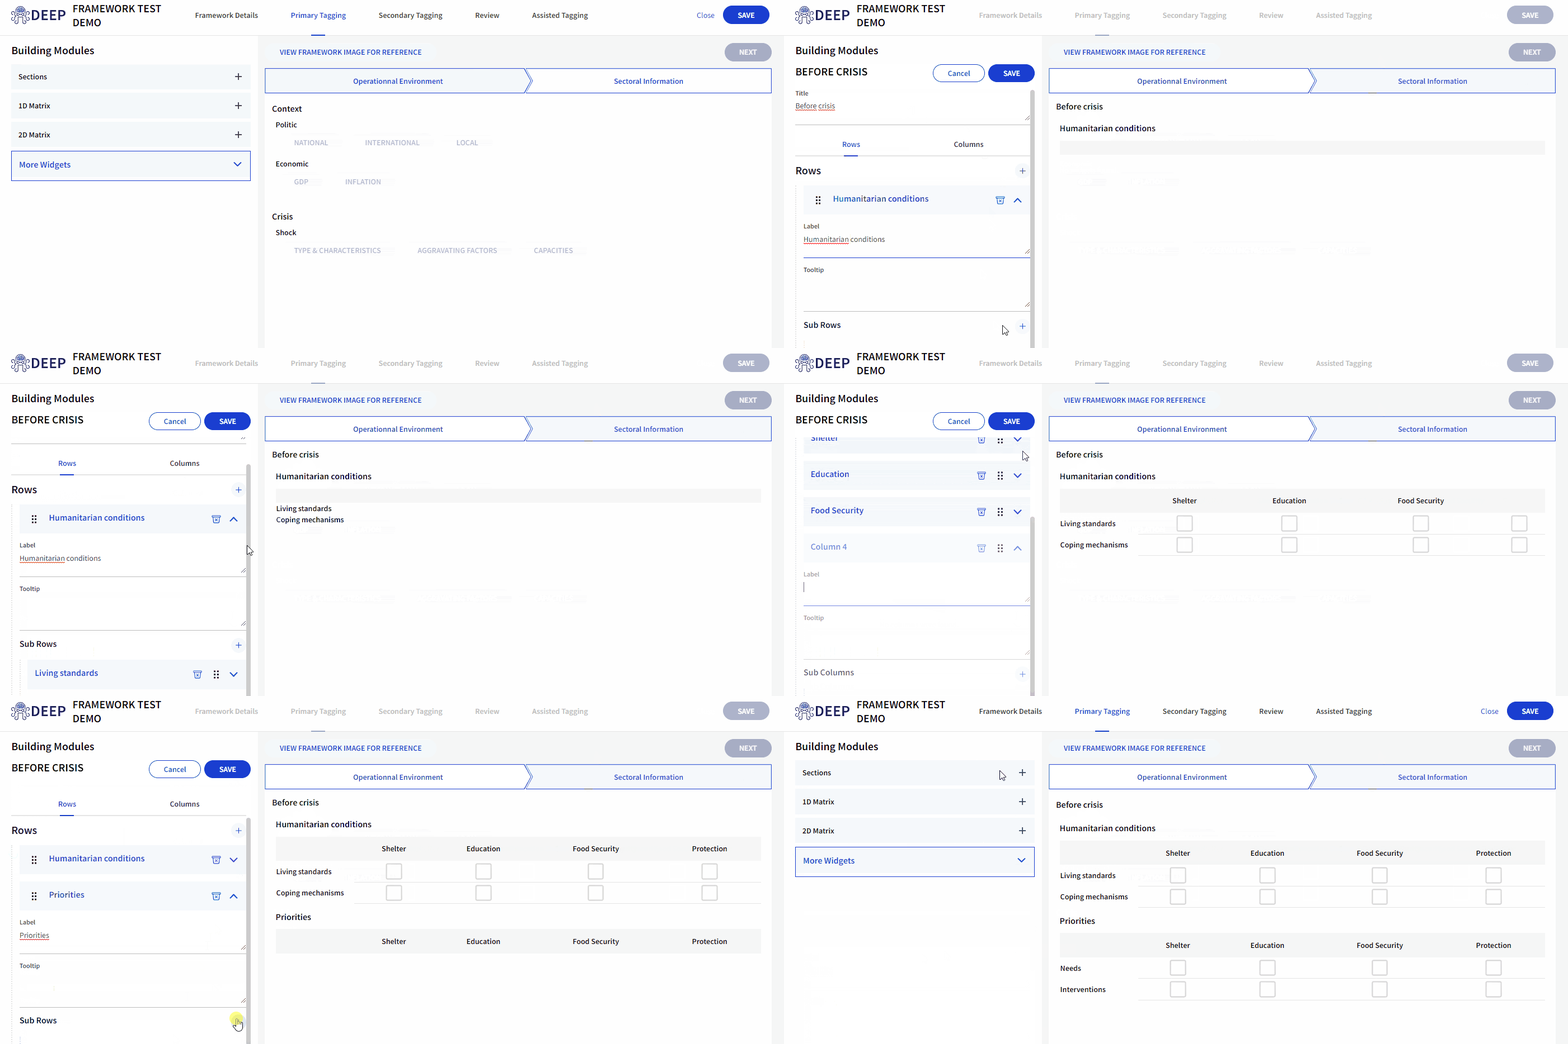
Creating a two dimensional matrix is similar to creating a one dimension matrix. You first have to choose the section you want to create the matrix under, and then name your matrix.
Available tools allow you to create your matrix based on a row or sub rows (if you create a row, at least one sub row is required), columns and sub columns (which are not mandatory). You can add as many layers as you need to build your framework.
Once you’re satisfied with the rows and columns you’ve created, save your matrix.
More widgets
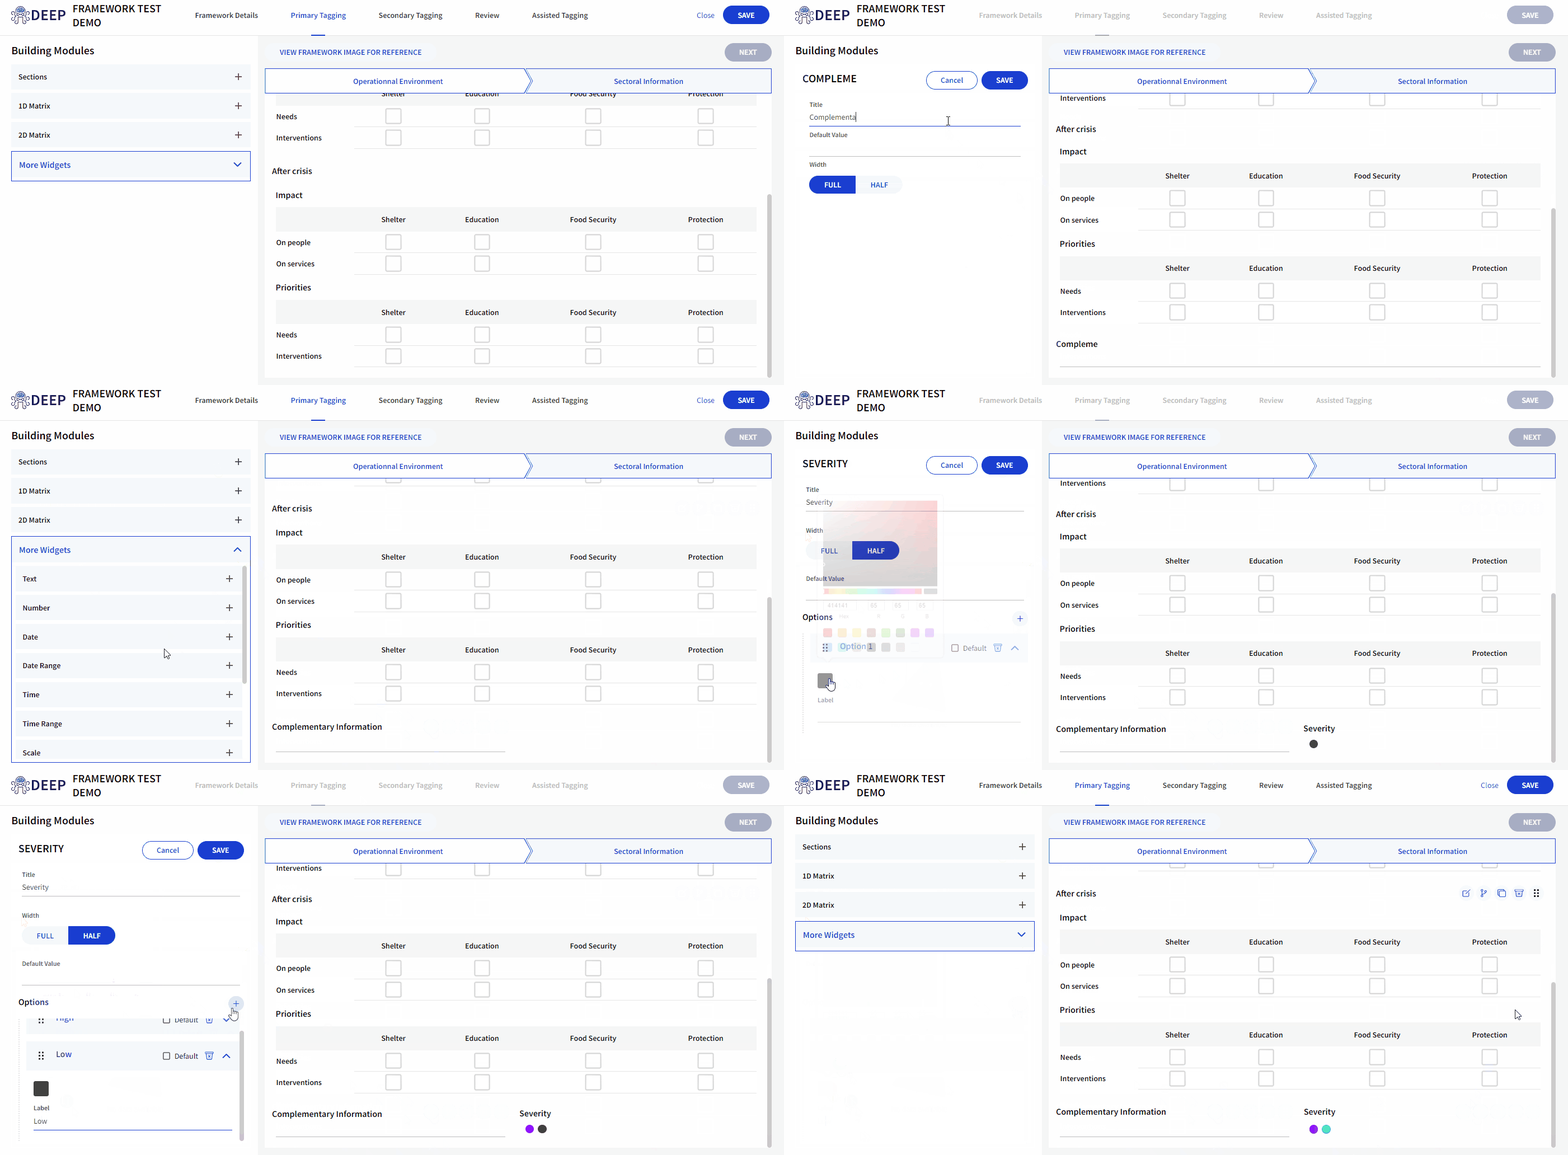
Other types of widgets are available and you can click on the arrow for the drop down list. If you want to create a widget, click on the + next to the identified one and follow up instructions.
For all modules, you’ll have to indicate the name for the widget and create it according to the design available.
You can determine the width of the space allocated by widgets in your space. This is helpful if you want to incorporate multiple widgets.
Edit existing modules
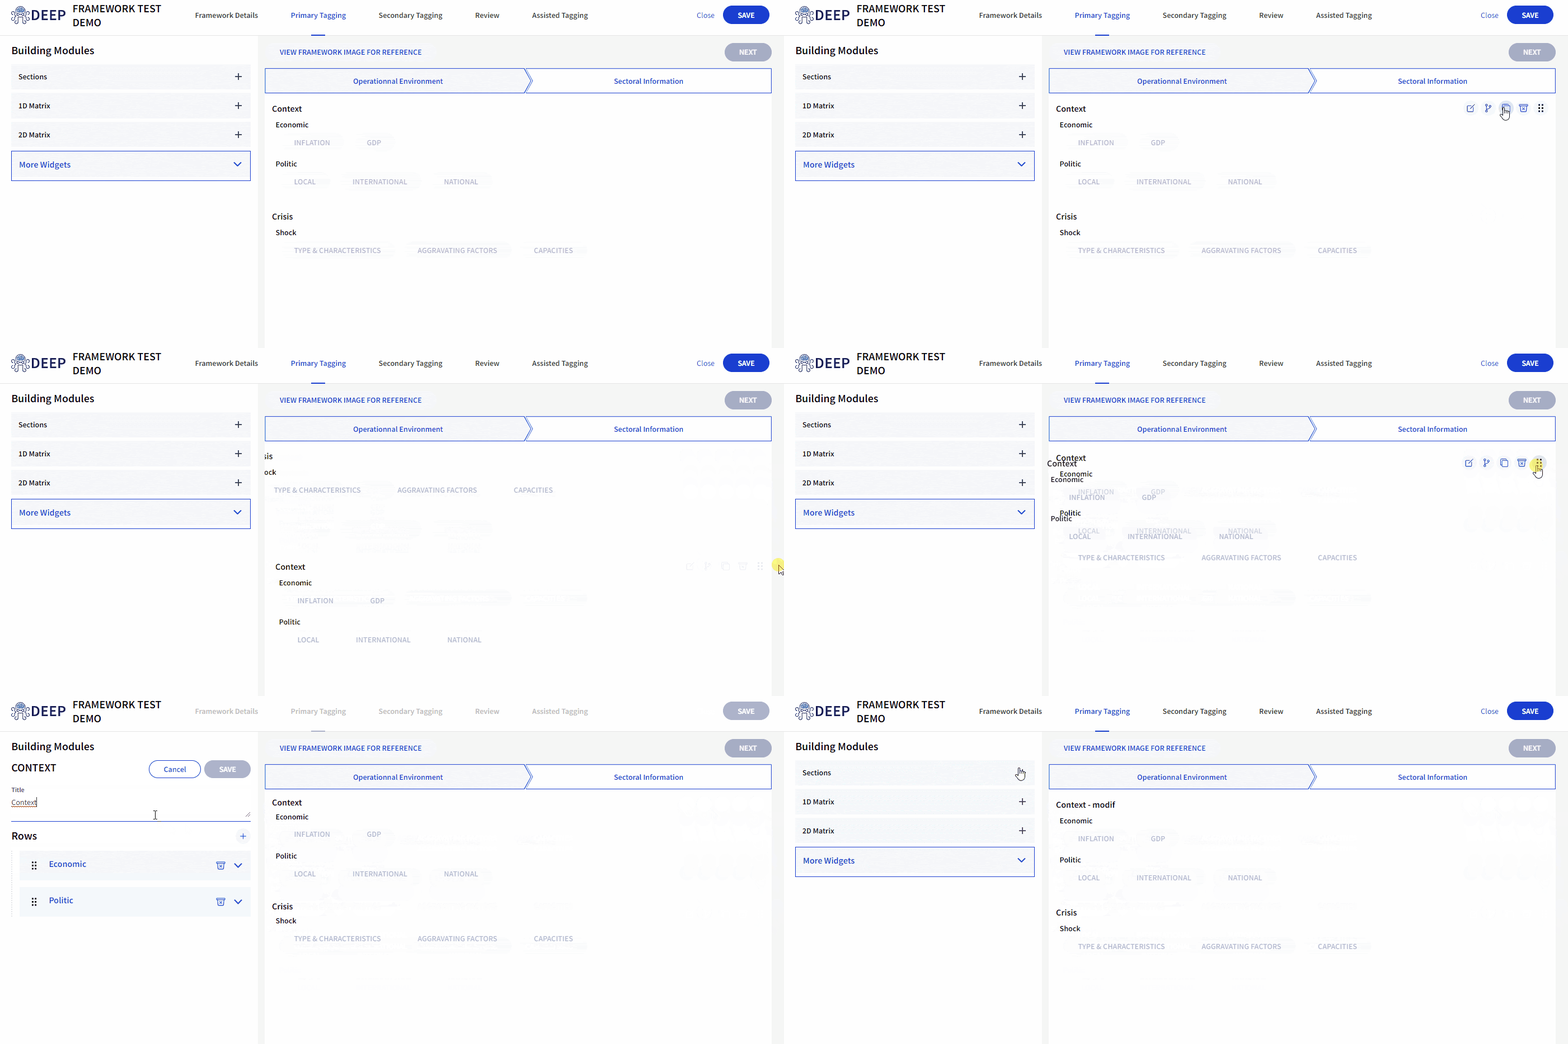
Once your matrix and complementary widgets are saved you can directly access them in the matrix in the central screen.
Section
For the main section, you can edit them by clicking on the pen that appears when you place your mouse in the section insert. You then access the list of sections and you can edit them, move them around and delete them.
Matrix and other widgets
In your central screen, if you place your mouse on a widget, on the right corner icons appear allowing you to edit widget, add widget conditions, clone widget, delete widget and drag widget to change the order/place in your framework.
Secondary Tagging Tab
Modules available in secondary tagging are listed under More Widgets and are to be used similarly to widgets presented in the primary Tagging section.
For all widgets you need to fill a title that will appear in your framework and you then have several options depending on the type of widget you’ve chosen.
You can determine the width of the space allocated by widgets in your secondary tagging area. Determine a range and assign minimal and maximal values. For scale you need to identify different colors to materialize the scale you want to work on. Default values and options in Single select or Multiple select widget are the different propositions you will have within the scrolling menu when clicking on your widget.
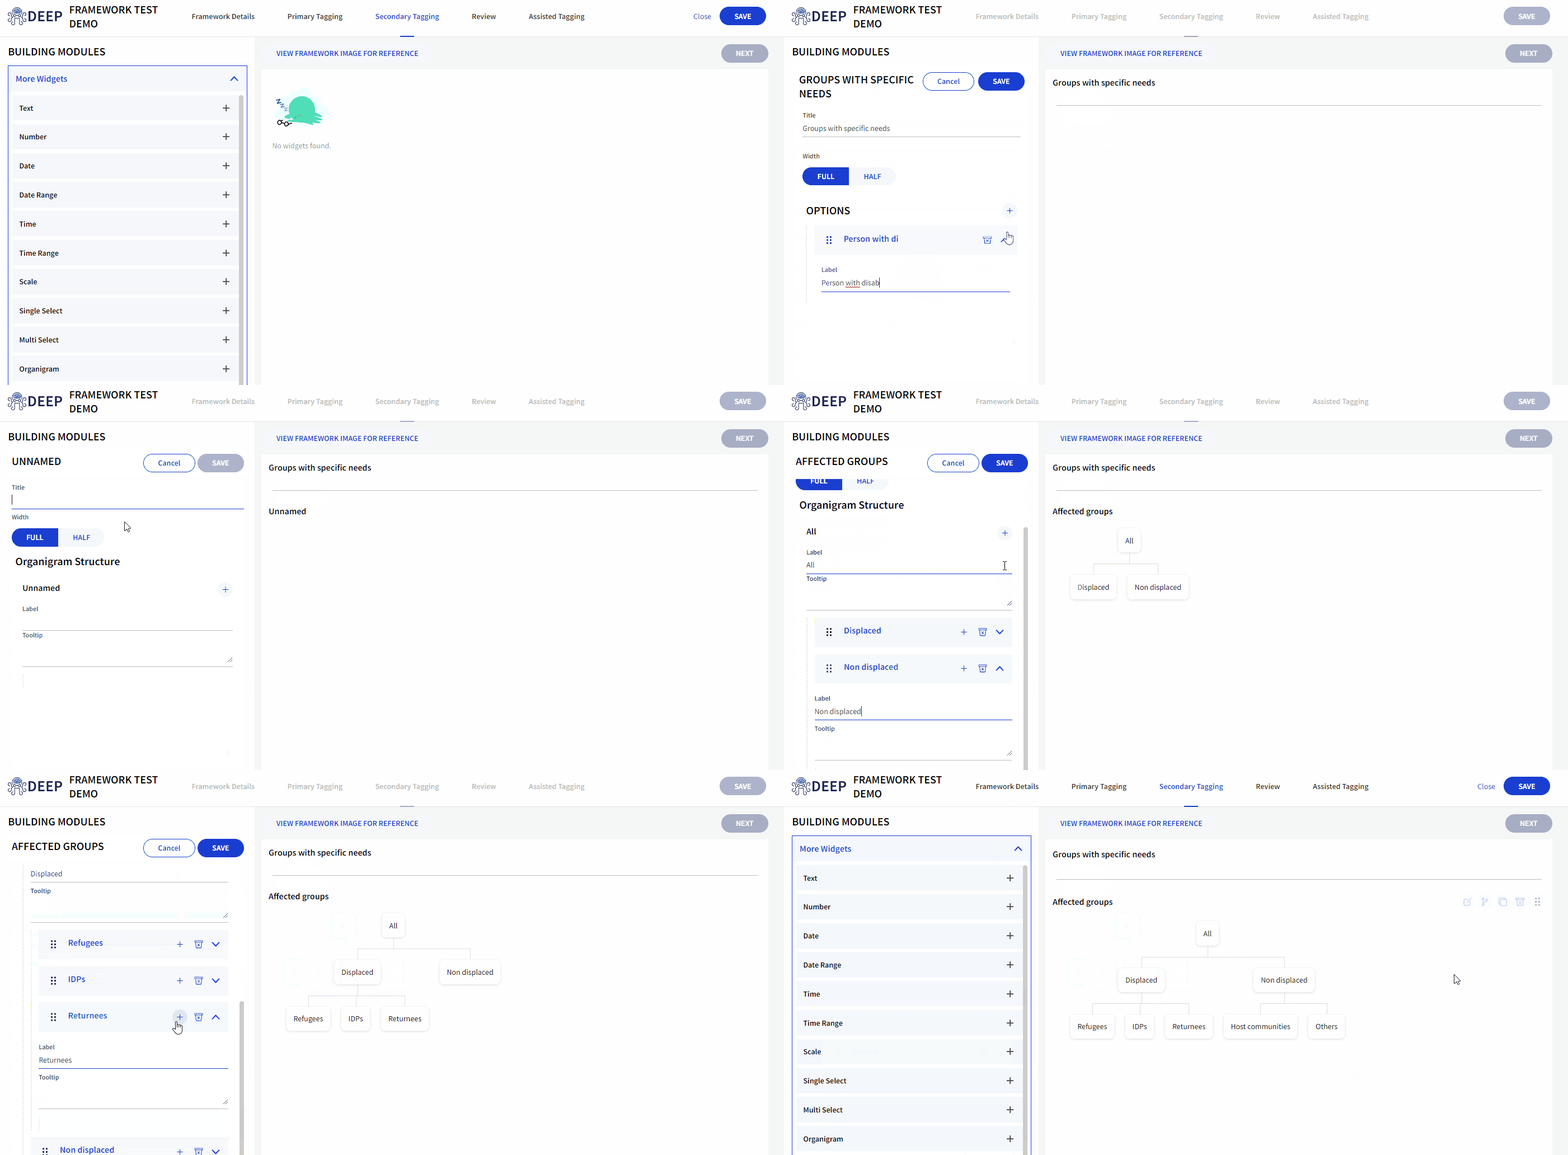
For the organigram widget, complete the title and then organize the structure beginning with a label that will be at the top of your organigram. Then click on + to the right of your label and you can create subcategories. Within each subcategory, you can create new categories and continue to build your organigram adding the number of layers you need.
Advice: To ease the creation of the organigram, use the row to develop or hide the subcategories created, identify your different layers easily, and label your layers accordingly.
Regarding the Geo modules, after clicking on +, name your widget and save. Then when your framework is selected and you start tagging, the geo widget will use geographical boundaries uploaded when your project has been created (geographical areas), essentially once selected it just allows you to display the map widget of your project.
Review Tab
When your secondary tagging is complete, move to the Review tab for an overview of your framework.
Assisted Tagging Tab
When creating a new framework, you need to save your framework first to be able to match it with the Natural Language Processing (NLP) framework.
When you’re working on a framework that you have created or a framework cloned that you’re able to edit, you can use the assisted Tagging feature. To see how the Assisted Tagging feature is then used, look at the corresponding section in tagging. This assisted tagging is based on NLP. More information on NLP coming soon.
When you’re in the Assisted Tagging tab, switch on the Active button on the top right side of your screen. It highlights the NLP framework on the left part of your screen.
The exercise here is to match your framework with the NLP framework (the assisted tagging is currently limited to common frameworks, although in the future DEEP envisions this being available to all frameworks on the platform). Once you’re active, you can start to look for the categories to match between the NLP framework on your left and your framework on your right. Choose a category on the NLP framework and then choose the corresponding category on your framework.
While matching categories, you’ll see the matching scale that progresses. It is not mandatory to complete entirely the scale to use the assisted Tagging but it won’t be as effective, the more of the matching is completed, better the assisted Tagging will work.
Once you’ve finished matching, make sure you also select the geo widget so that DEEP can show you the location based on what you activate as a secondary tag.
Save your work. Once you’ve enabled this feature and aligned your framework, you will see the option to use assisted Tagging appears in the Tagging page.

To learn more about the feature, you can watch an overview here and a technical explanation here. The more you use this feature, and the more you use DEEP, the smarter we all become!
To learn more about the feature, you can watch an overview here and a technical explanation here. The more you use this feature, and the more you use DEEP, the smarter we all become!
Visualization Settings Tab
Coming soon
You can also click on “Is Visualization Enabled” that opens a new tab called “Visualization Settings”. More information about the Visualization Settings tab will come soon in the DEEP User Guide!
Connectors
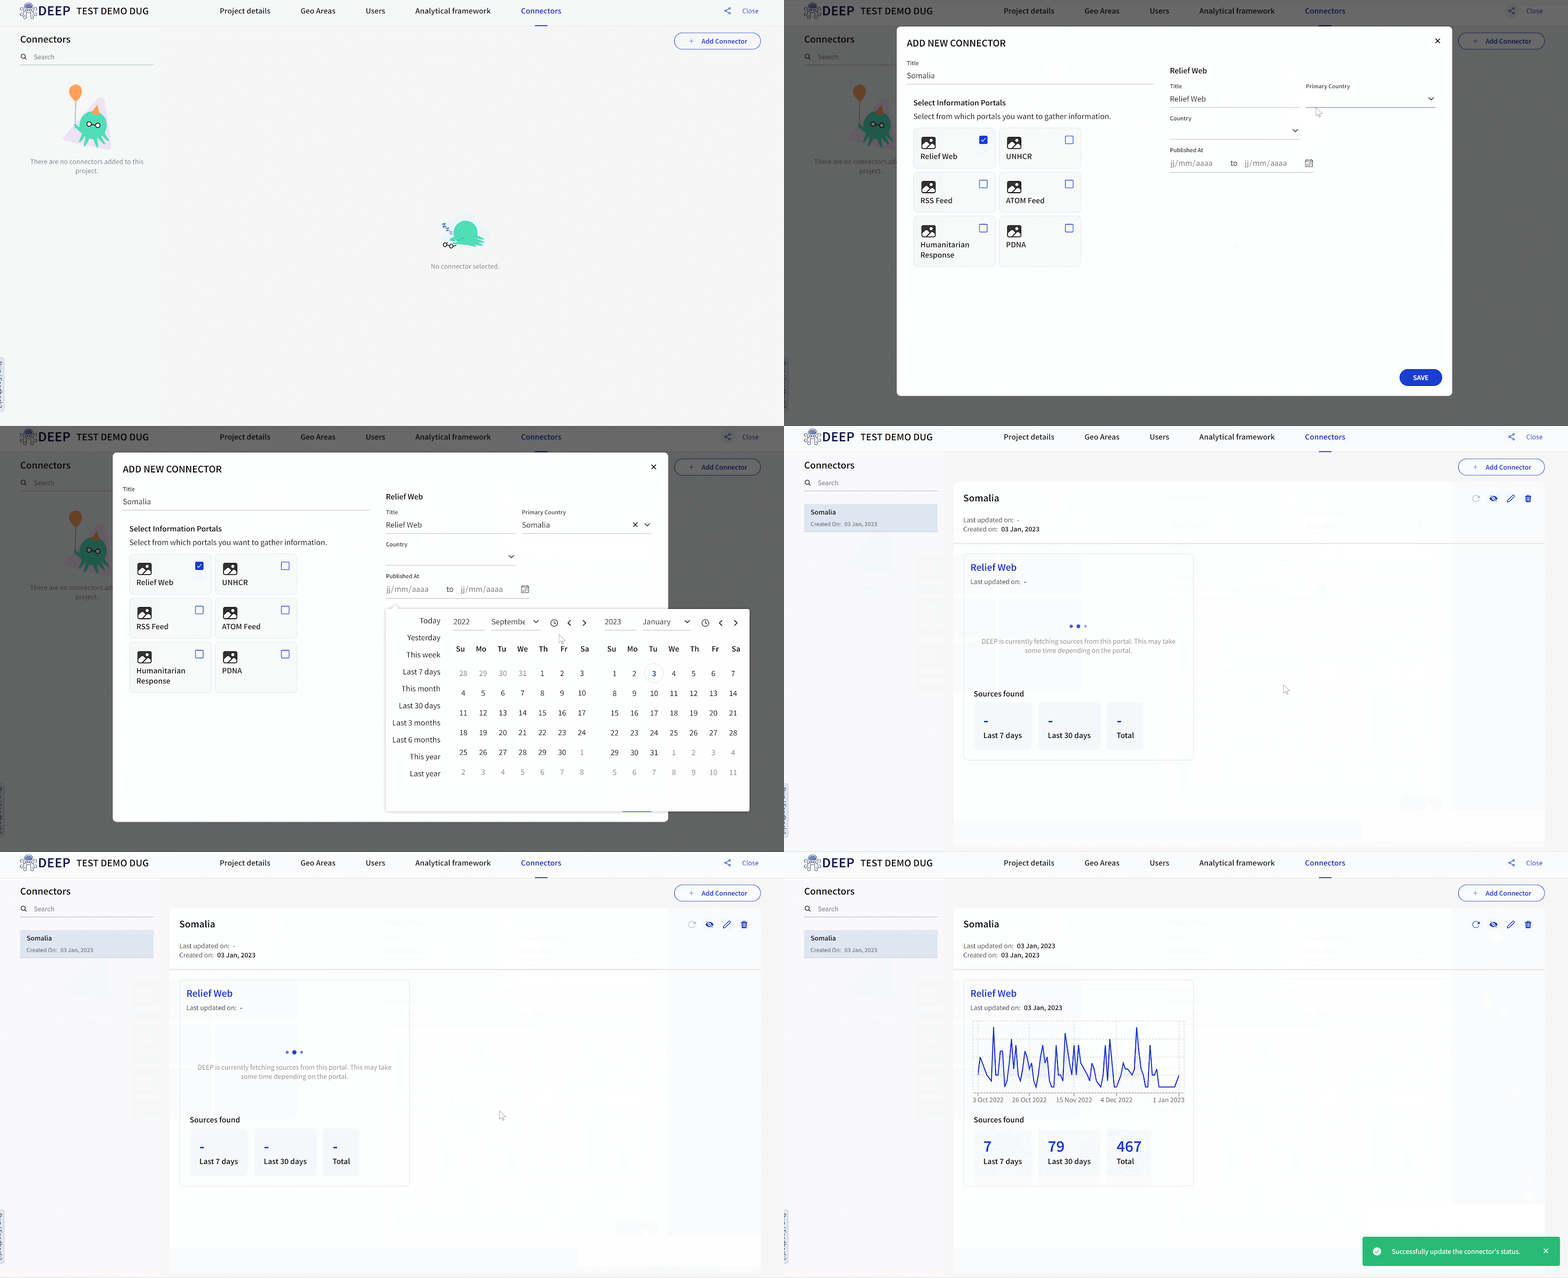
When you click on Connectors, you will be directed to a page enabling you to connect data platforms with your project in order to find sources easily. For more information on the usefulness and the utilization of such connectors in the Tagging process, please see the Tagging section of this manual.
Click on the Add Connector button. A window will open with six potential data platforms that you can pick (Reliefweb, UNHCR Portal, RSS Feed, ATOM Feed, Humanitarian Response and Post Disaster Needs Assessment) and connect to your project. More connectors can be created by the DEEP development team depending on the needs of the users. If you face the need to have a new Connector created, please fill in the contact form to reach out to the DEEP team.
Choose a name for your connector, a country to which you want to connect and dates in between which the sources you will curate must have been published.
If you have done such for other projects, your former connectors will appear on the left of the page and you will be able to pick them.
You can easily edit or discard a connector by clicking on the pen or bin icons. You can also disable and enable the connector again by clicking on the eye button.
You can see the number of sources published by clicking on the arrow icon.
Editing a project
To edit a project you created or for which you are an administrator, return to the pages you used for the creation of your project.
On the Home page, go to the Recent Projects section. Select the project you want to edit in the scrolling menu on the right.
When you select your project, it will appear below. You can then see all details. To edit click on the pen button.
You will land on the page used to create your project with the four same categories: Project details, Geographic Areas, Users, Analytical Framework. You can roam the categories, delete the unwanted fields and add or change what is needed. Either delete and type new text, click on the bin icon, click on the add buttons or click on the pen buttons depending on the fields. For more information, please refer to the Set up a new project section.


.png)


